using UnfoldMakie
using CairoMakie
There are dozens of standard and arbitrary ways to set electrodes. UnfoldMakie bundles predefined 23 montages with their labels and channel positions.
list_montages()23-element Vector{String}:
"EGI_256"
"GSN-HydroCel-128"
"GSN-HydroCel-129"
"GSN-HydroCel-256"
"GSN-HydroCel-257"
"GSN-HydroCel-32"
"GSN-HydroCel-64_1.0"
"GSN-HydroCel-65_1.0"
"artinis-brite23"
"artinis-octamon"
⋮
"brainproducts-RNP-BA-128"
"colin27_1005"
"colin27_1020"
"easycap-M1"
"easycap-M10"
"mgh60"
"mgh70"
"standard_1005"
"standard_1020"23 montage types
Montage groups and plotting helper
This demonstration groups related montages and creates a separate figure for each group. The helper adapts the figure and label sizes to the group and montage sizes.
function plot_montage_group(group_title, montage_names; ncols = 2)
    nrows = cld(length(montage_names), ncols)
    f = Figure(size = (600 * ncols, 450 * nrows))

    for (i, mname) in enumerate(montage_names)
        row = (i - 1) ÷ ncols + 1
        col = (i - 1) % ncols + 1
        montage = get_montage(mname)
        nchannels = length(montage.labels)
        fontsize = clamp(120 / sqrt(nchannels), 5, 12)

        ax = Axis(f[row, col]; title = mname, aspect = DataAspect())
        scatter!(ax, montage.positions; markersize = max(3, fontsize / 2))
        text!(
            ax,
            montage.labels,
            position = montage.positions,
            align = (:center, :center),
            fontsize = fontsize,
        )
        hidedecorations!(ax)
        hidespines!(ax)
    end

    Label(f[0, 1:ncols], group_title; fontsize = 24)
    f
end
plot_montage_group (generic function with 1 method)Each variable below represents one montage family.
biosemi = ["biosemi16", "biosemi32", "biosemi64", "biosemi128"]

gsn_hydrocel = [
    "GSN-HydroCel-32",
    "GSN-HydroCel-64_1.0",
    "GSN-HydroCel-65_1.0",
    "GSN-HydroCel-128",
    "GSN-HydroCel-129",
    "GSN-HydroCel-256",
    "GSN-HydroCel-257",
]

standard = ["standard_1020", "standard_1005"]
colin27 = ["colin27_1020", "colin27_1005"]
mgh = ["mgh60", "mgh70"]
artinis = ["artinis-octamon", "artinis-brite23"]
easycap = ["easycap-M1", "easycap-M10"]
brainproducts = ["brainproducts-RNP-BA-128"]
egi = ["EGI_256"]
1-element Vector{String}:
"EGI_256"BioSemi montages
plot_montage_group("BioSemi", biosemi)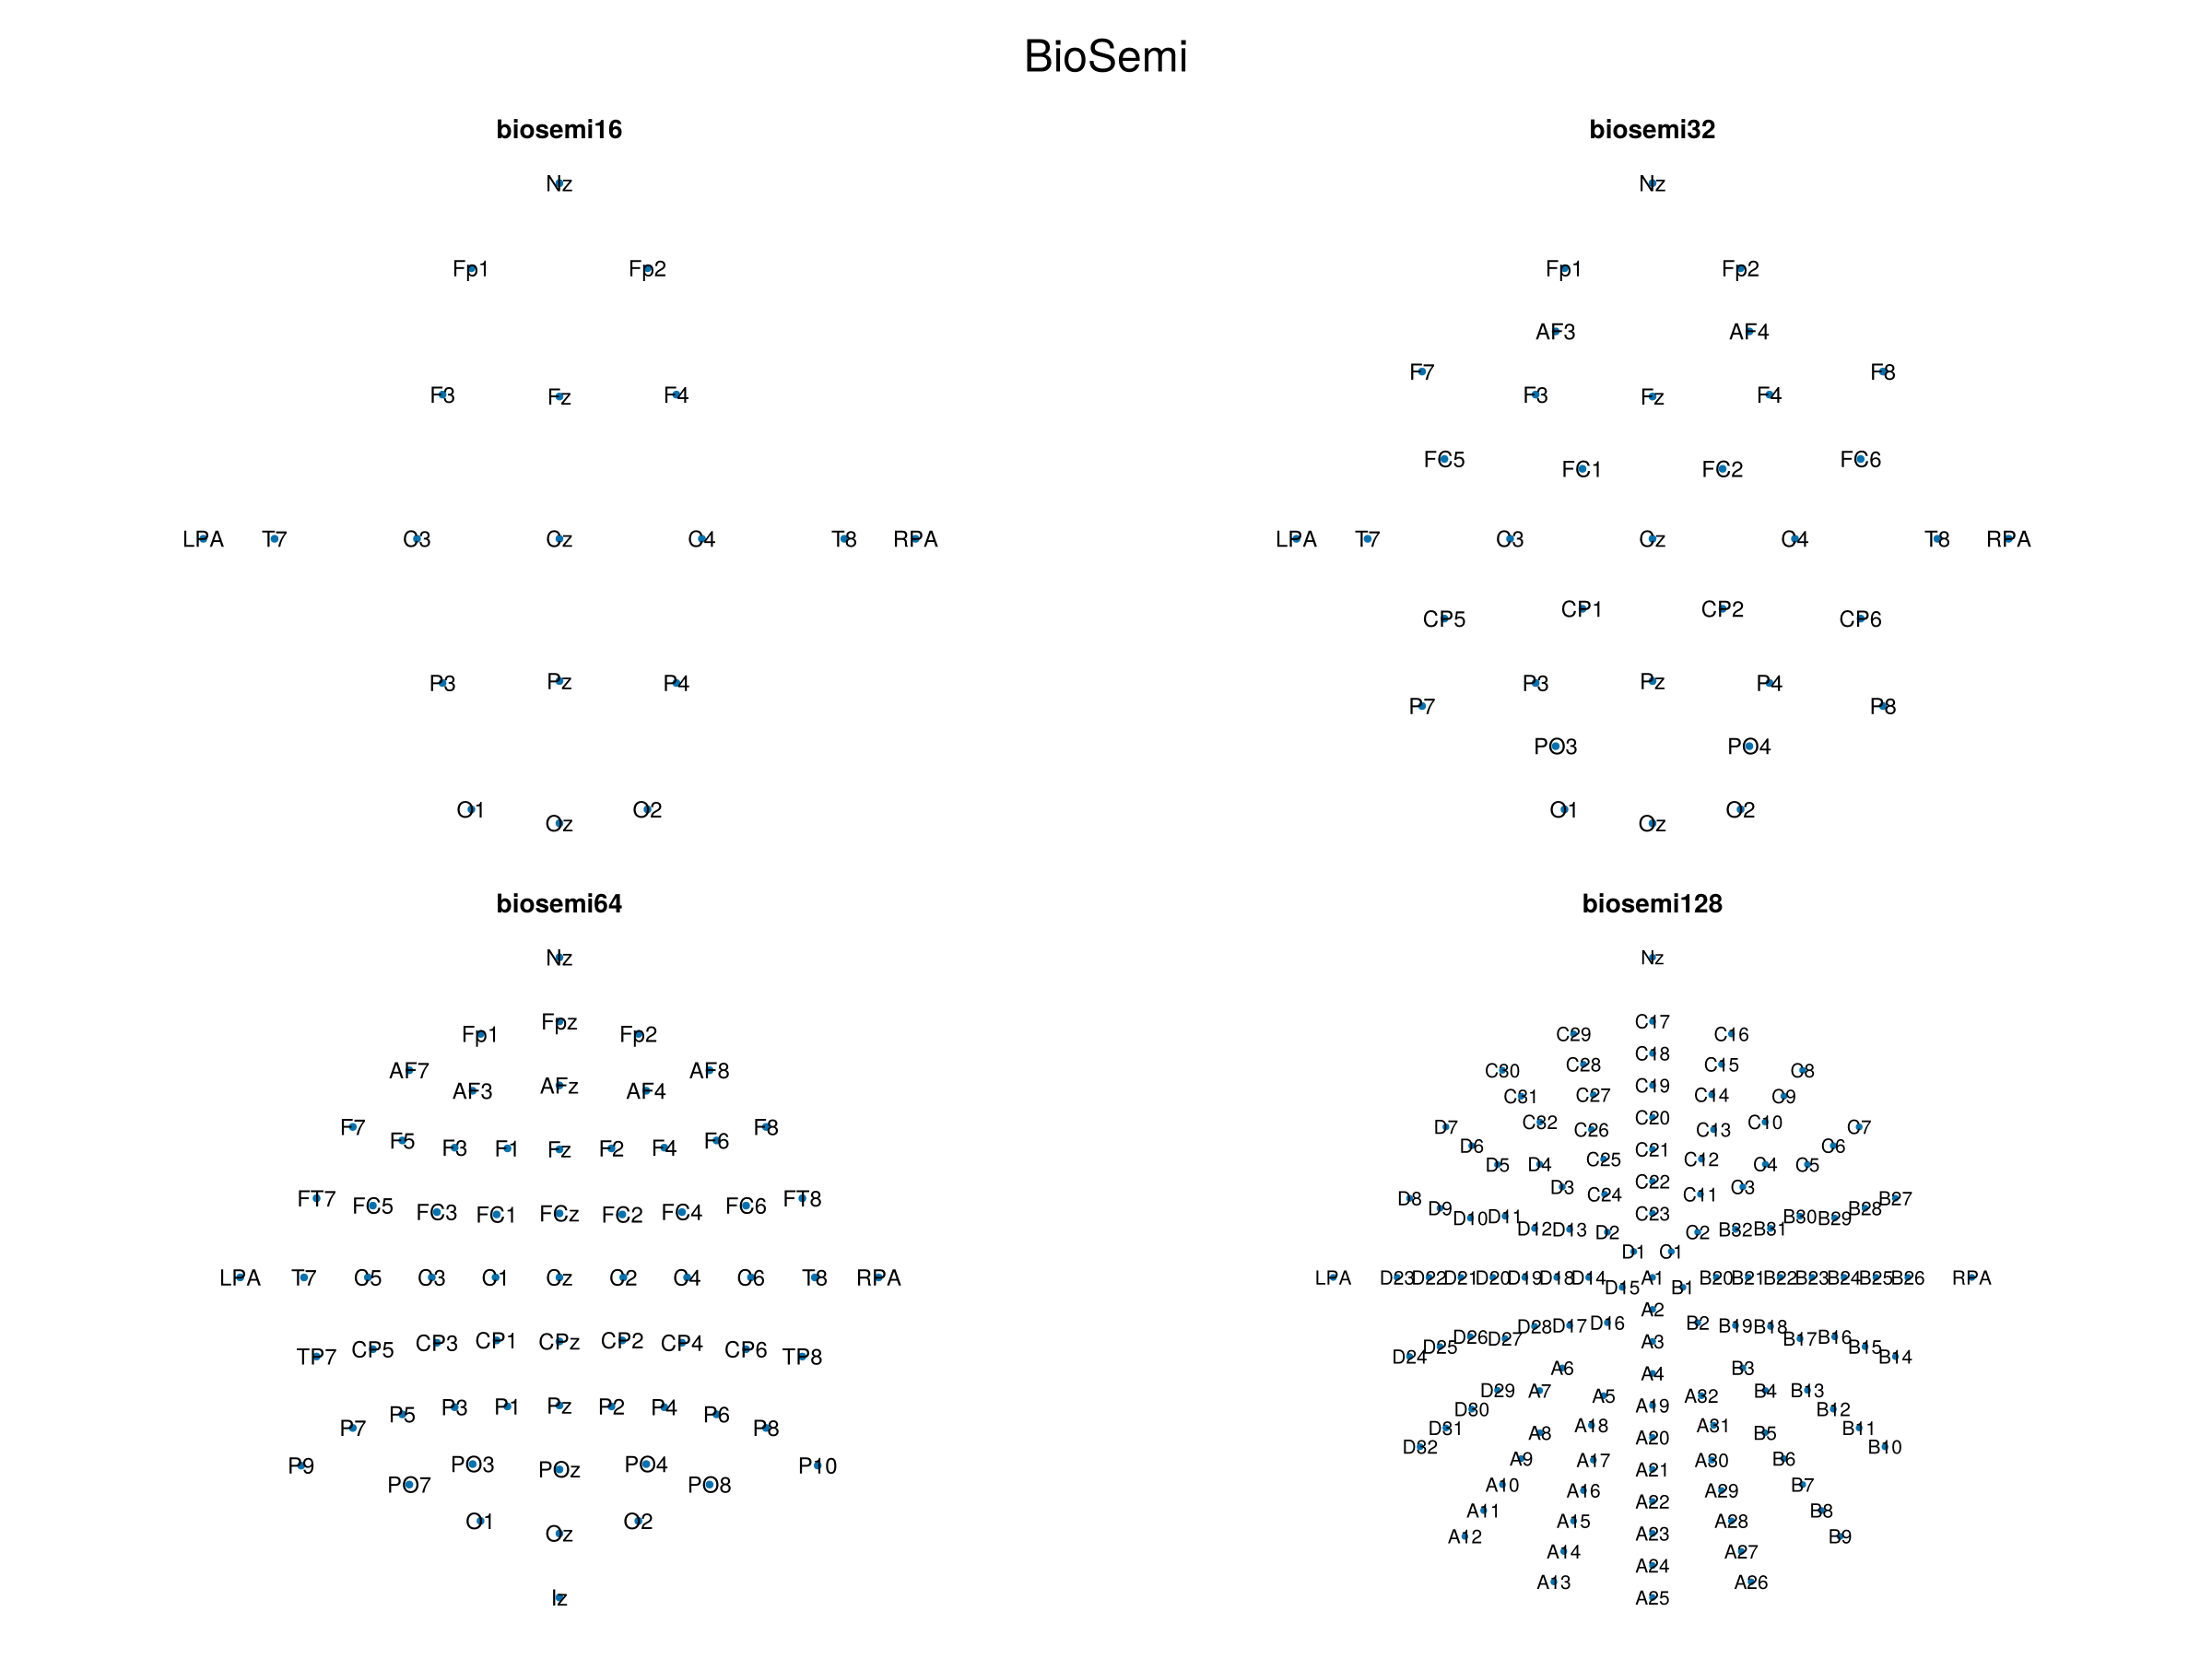
GSN HydroCel montages
plot_montage_group("GSN HydroCel", gsn_hydrocel)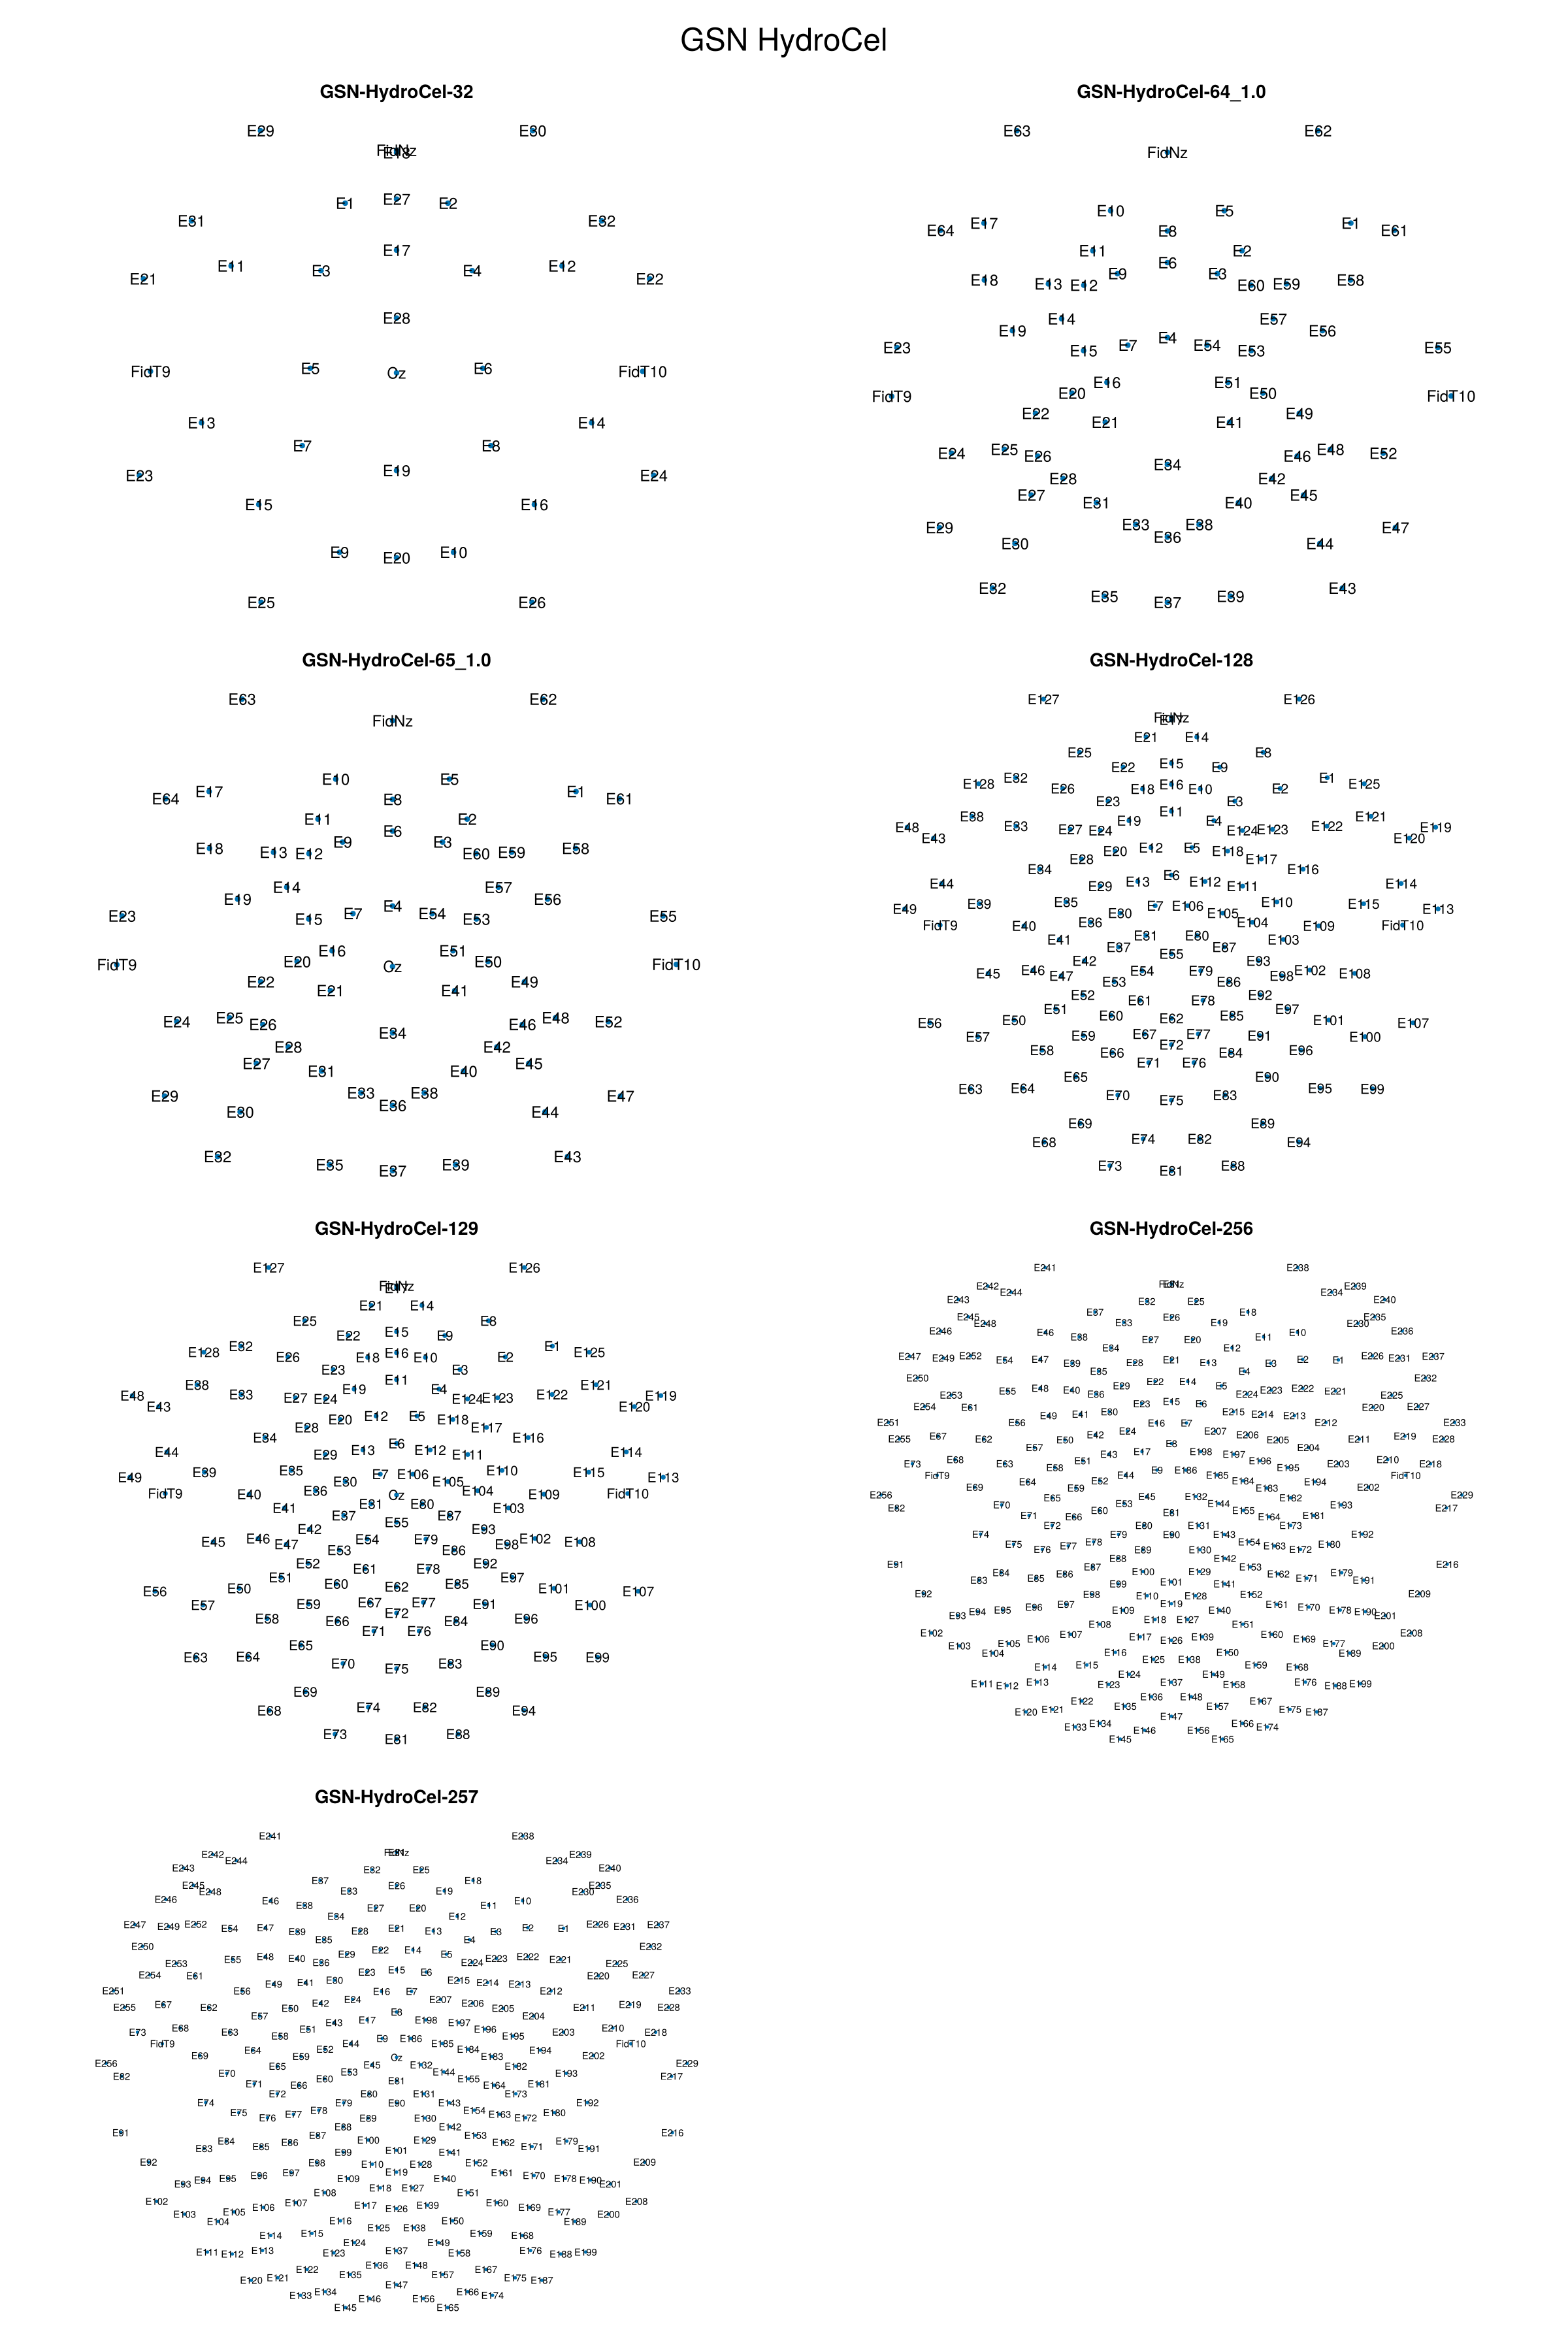
Standard EEG montages
plot_montage_group("Standard EEG", standard)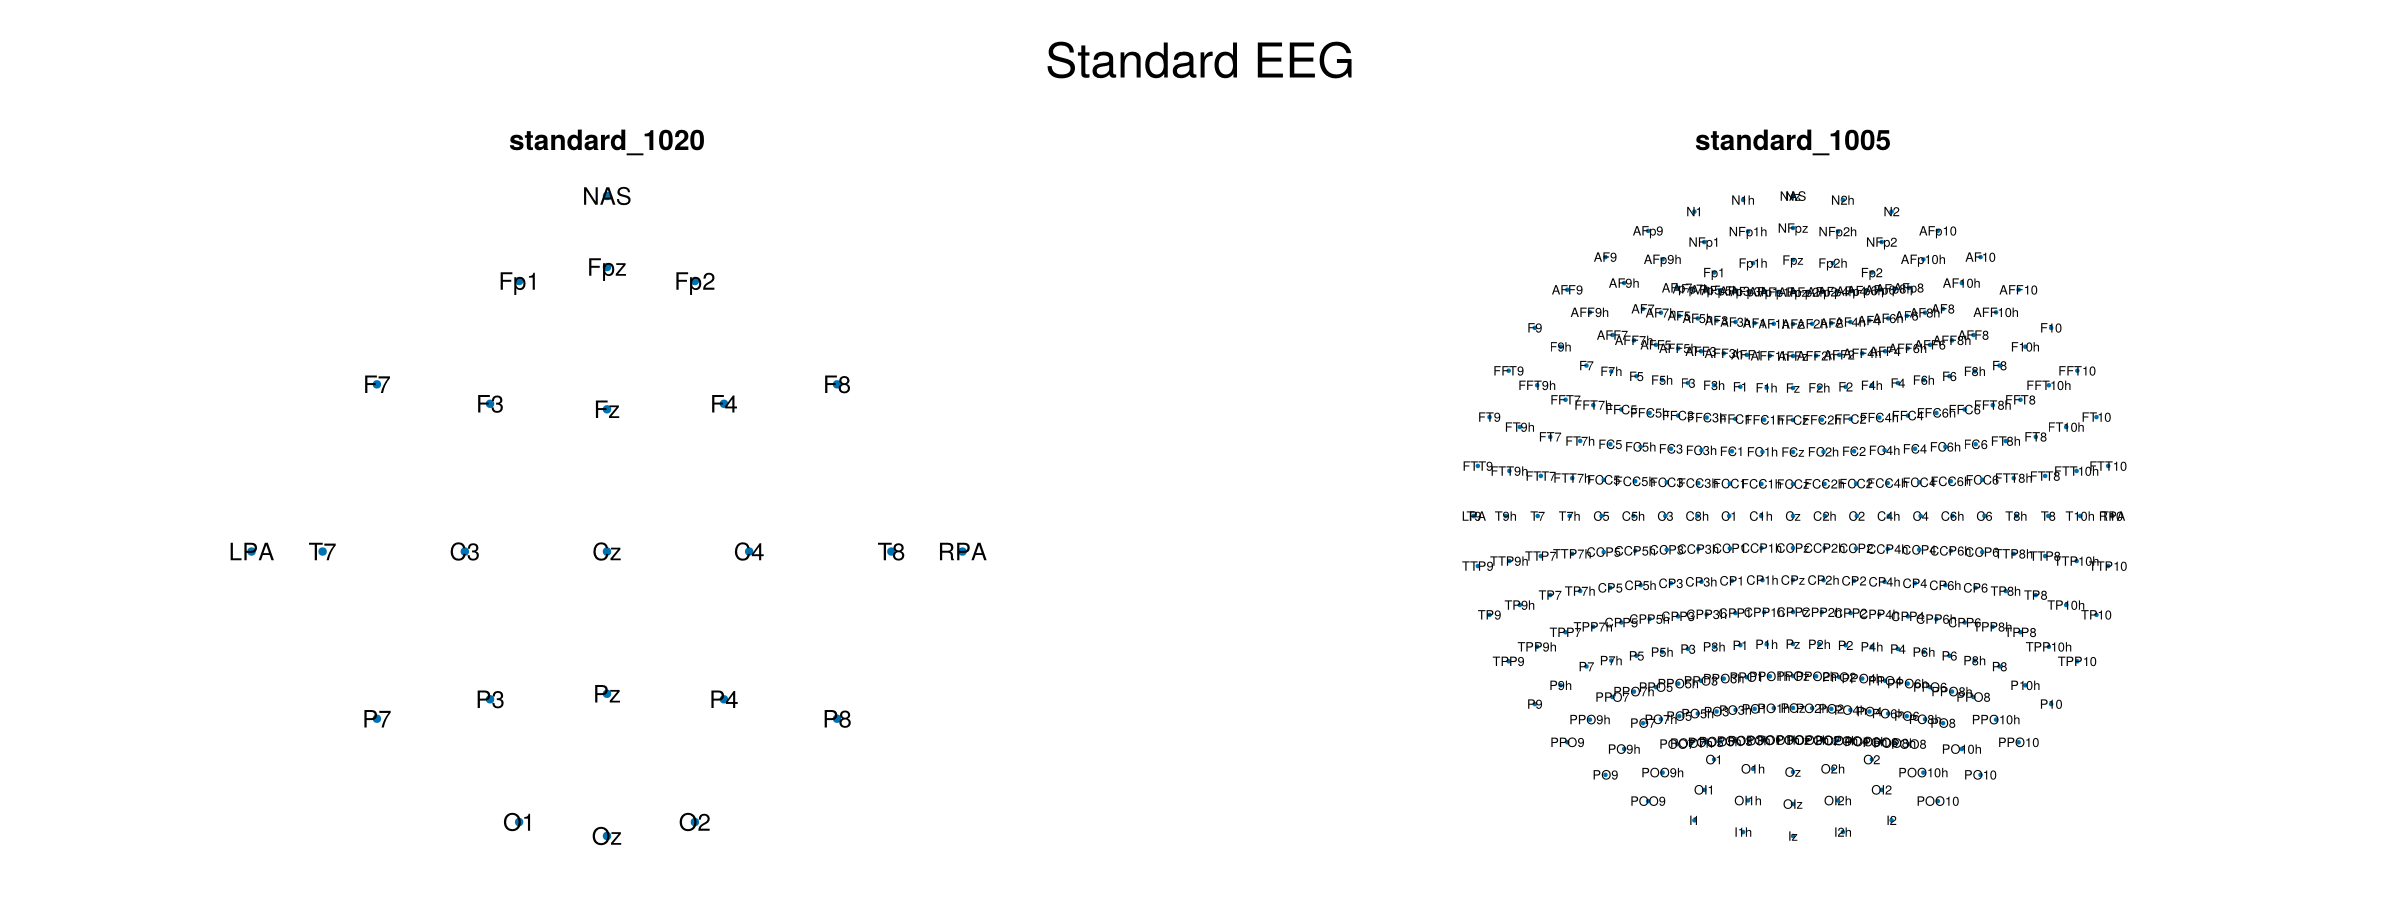
Colin27 montages
plot_montage_group("Colin27", colin27)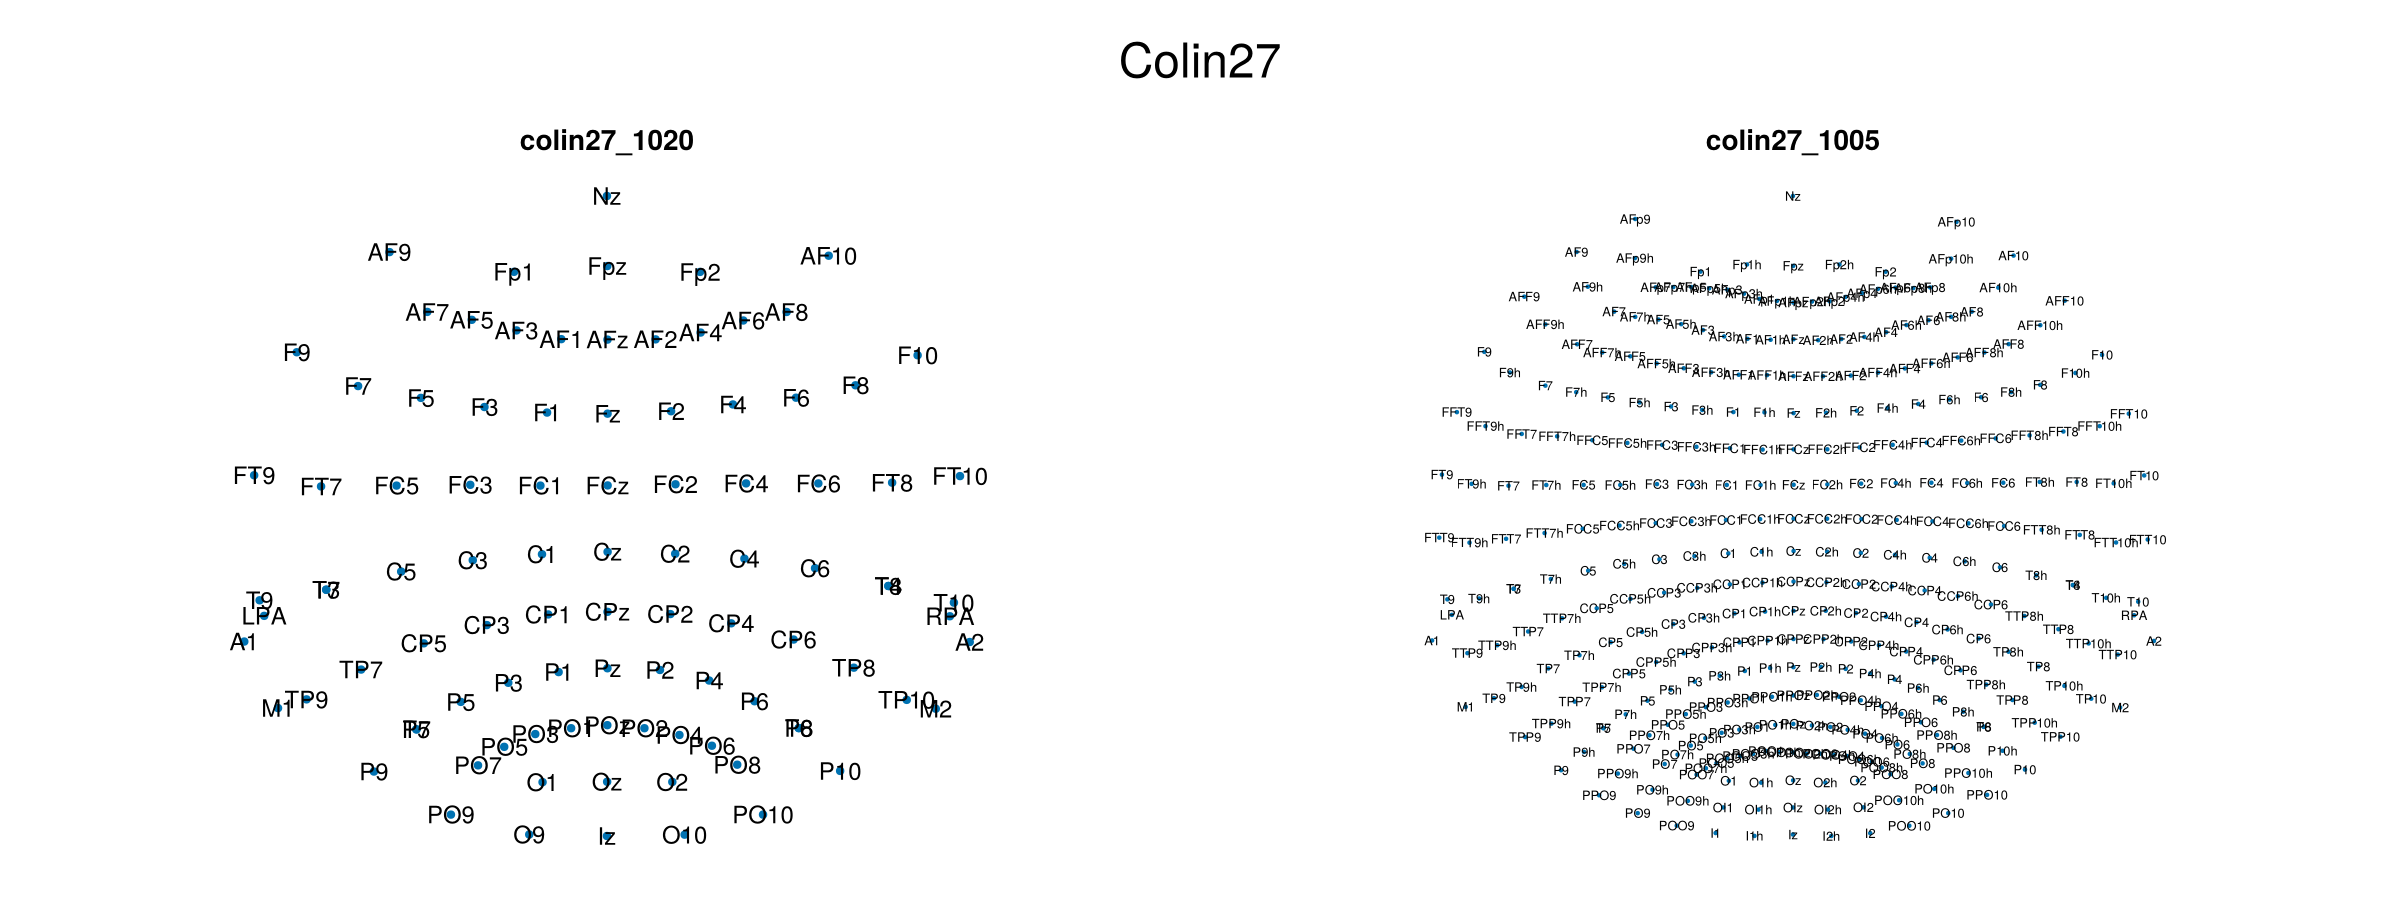
MGH montages
plot_montage_group("MGH", mgh)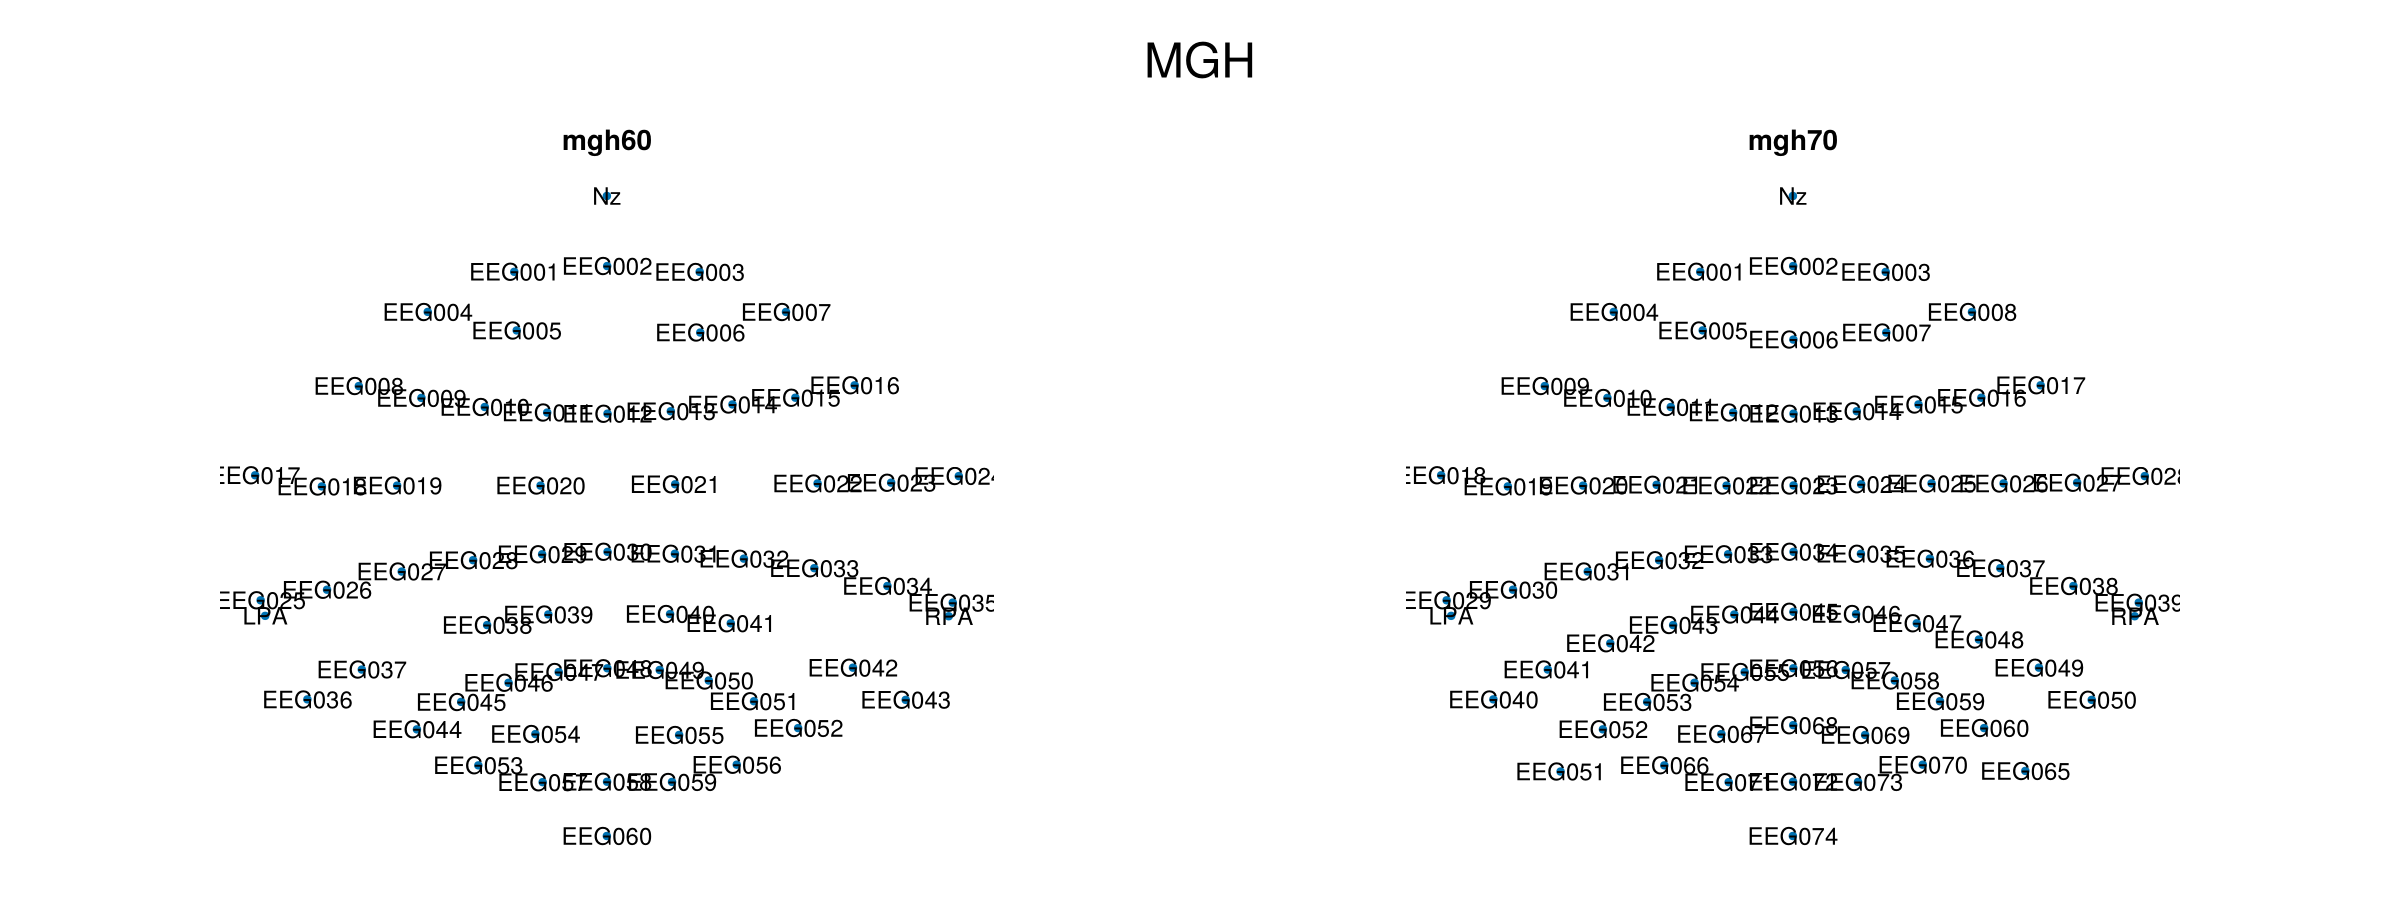
Artinis montages
plot_montage_group("Artinis", artinis)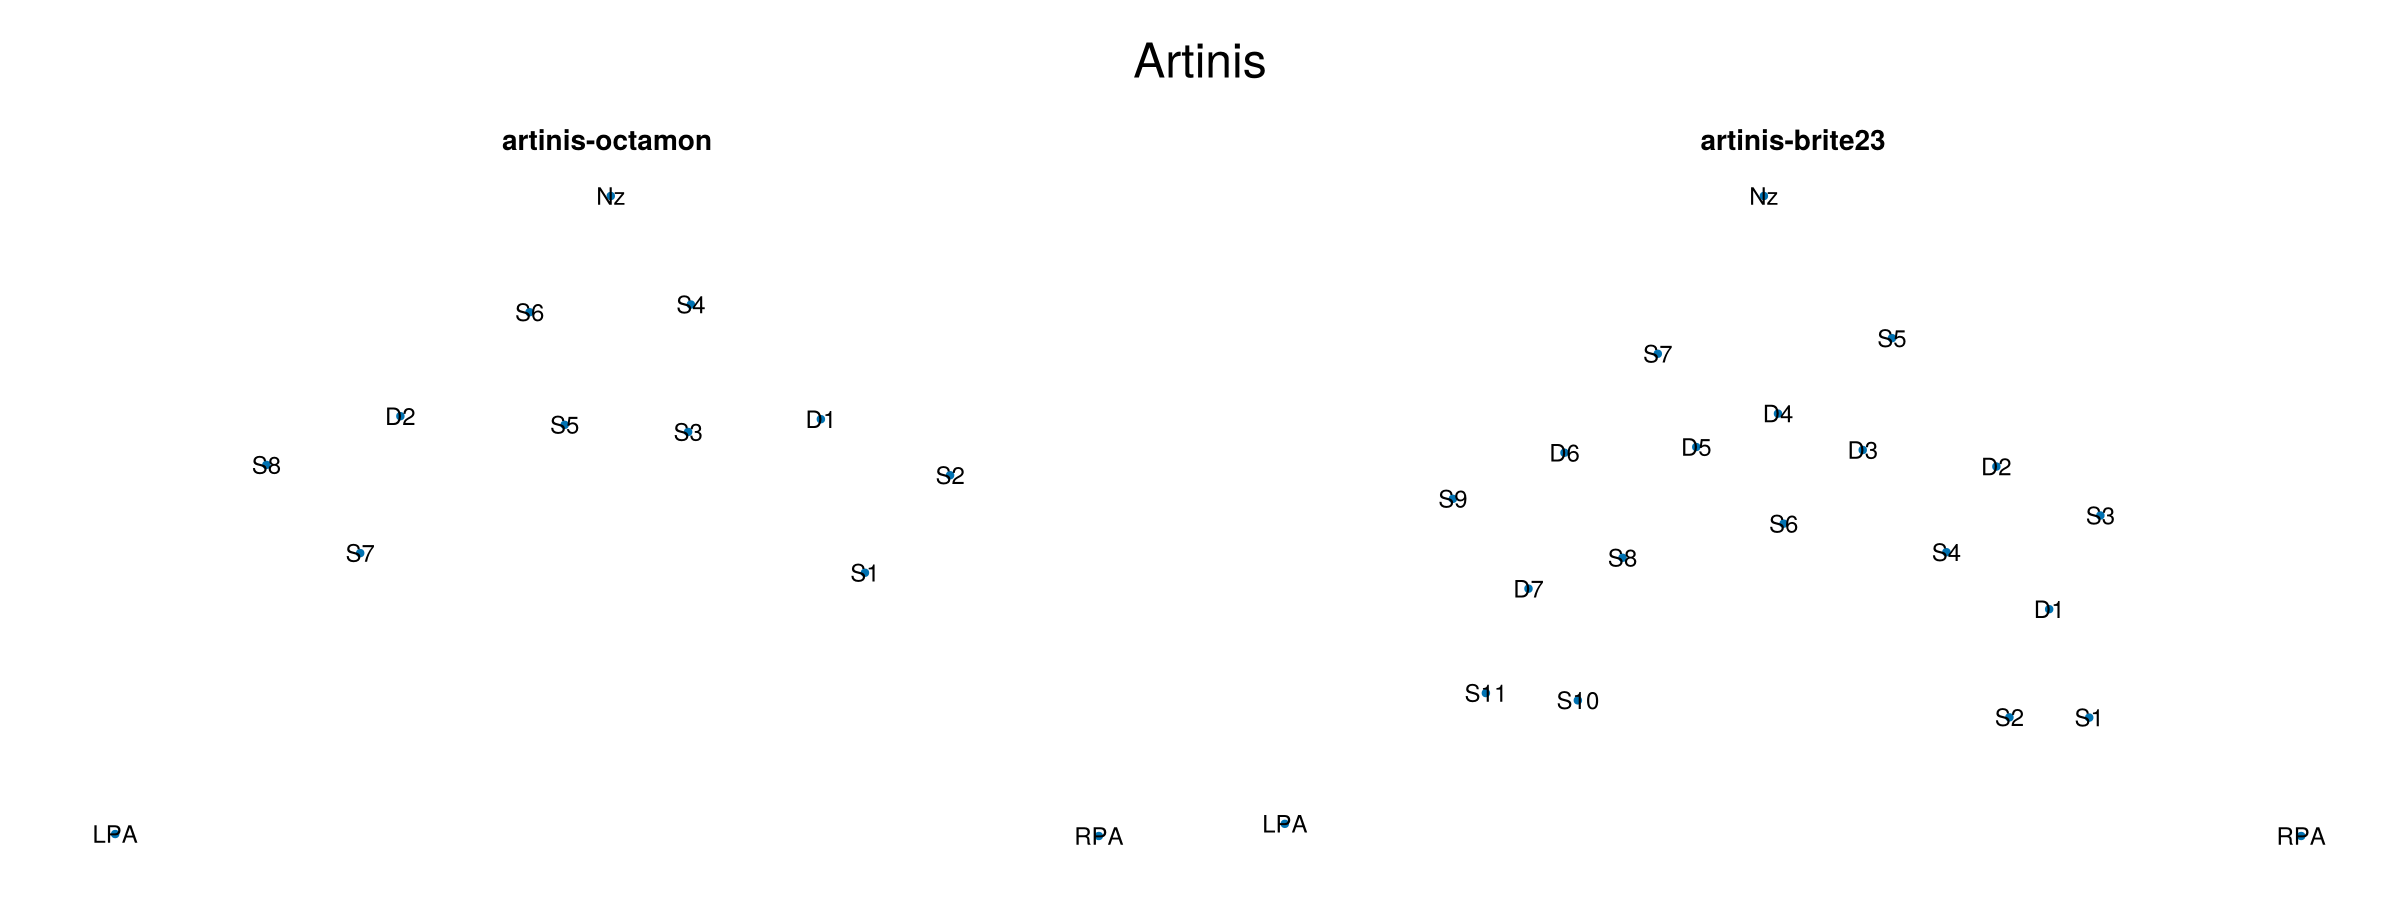
EasyCap montages
plot_montage_group("EasyCap", easycap)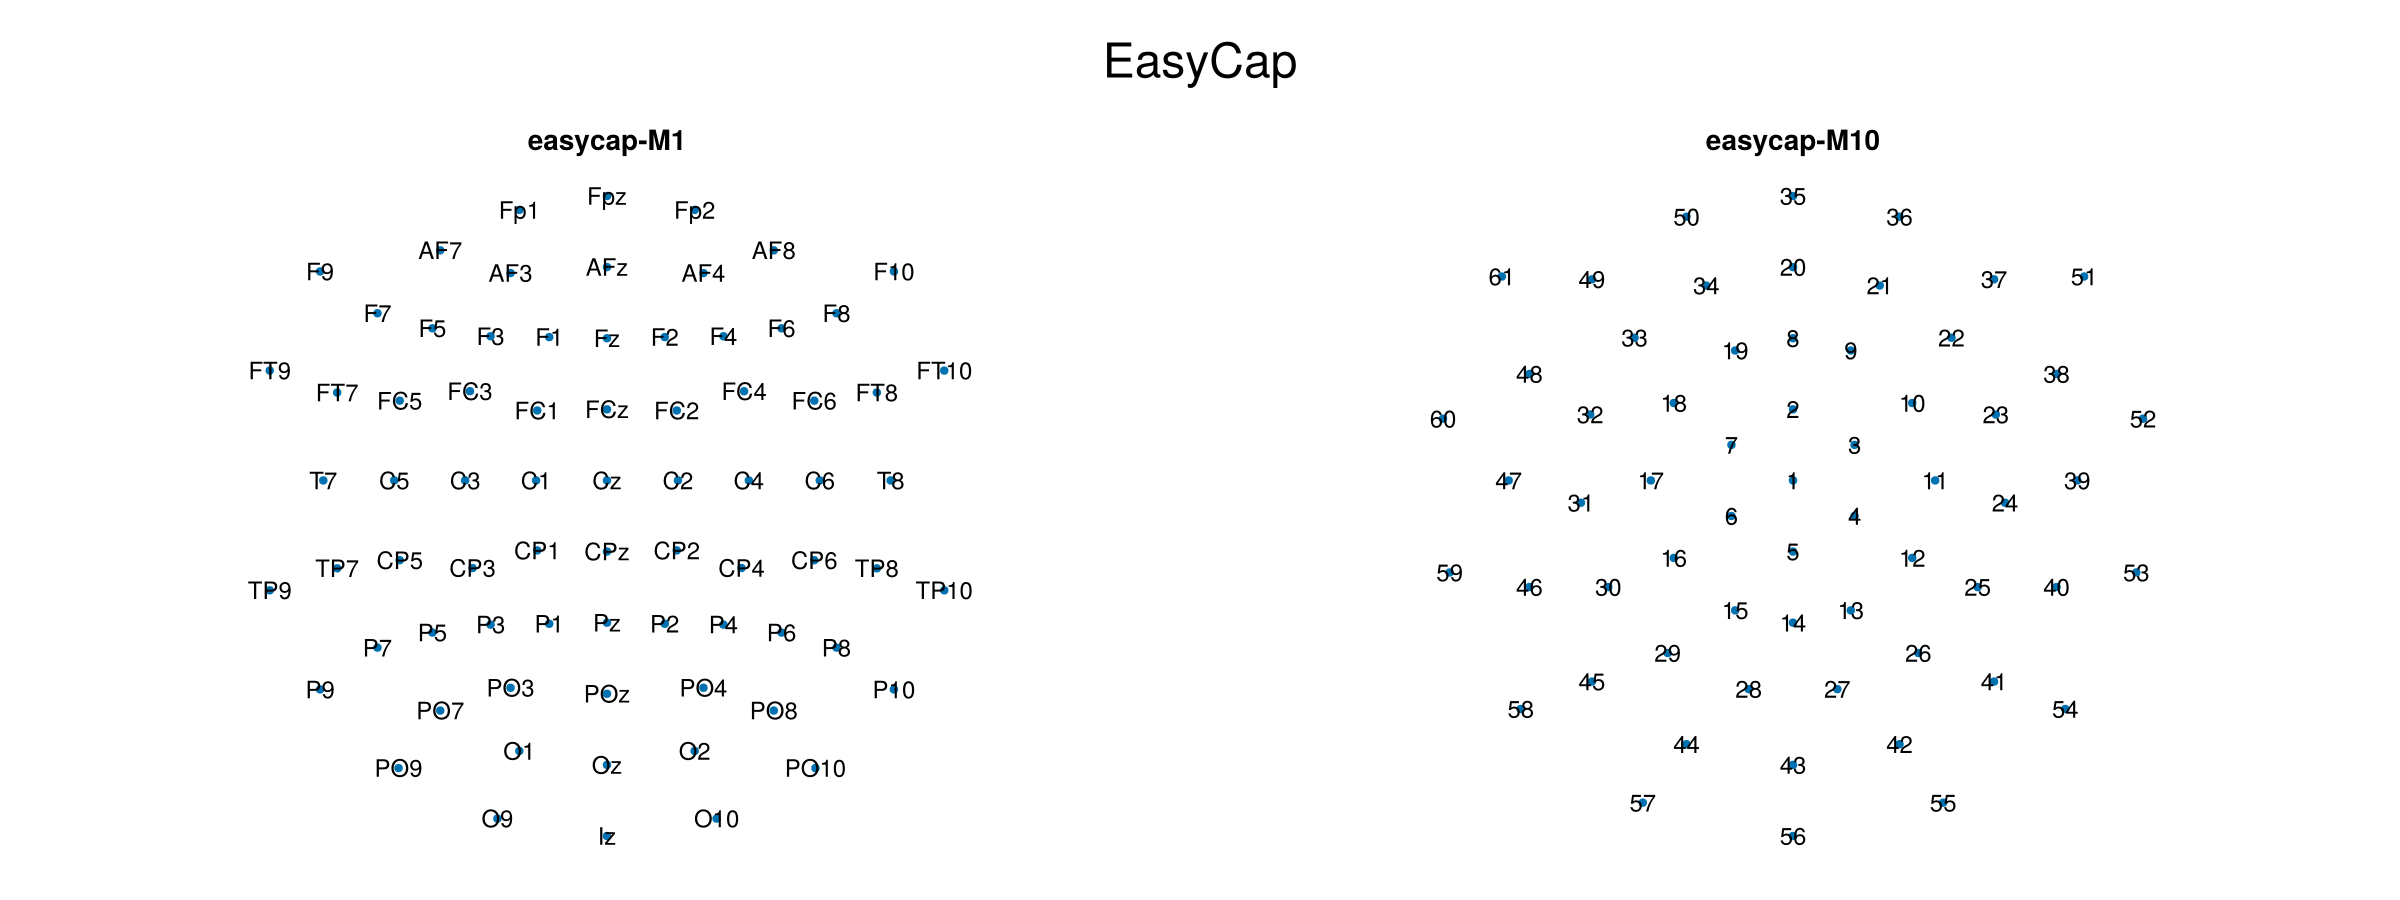
Brain Products montage
plot_montage_group("Brain Products", brainproducts)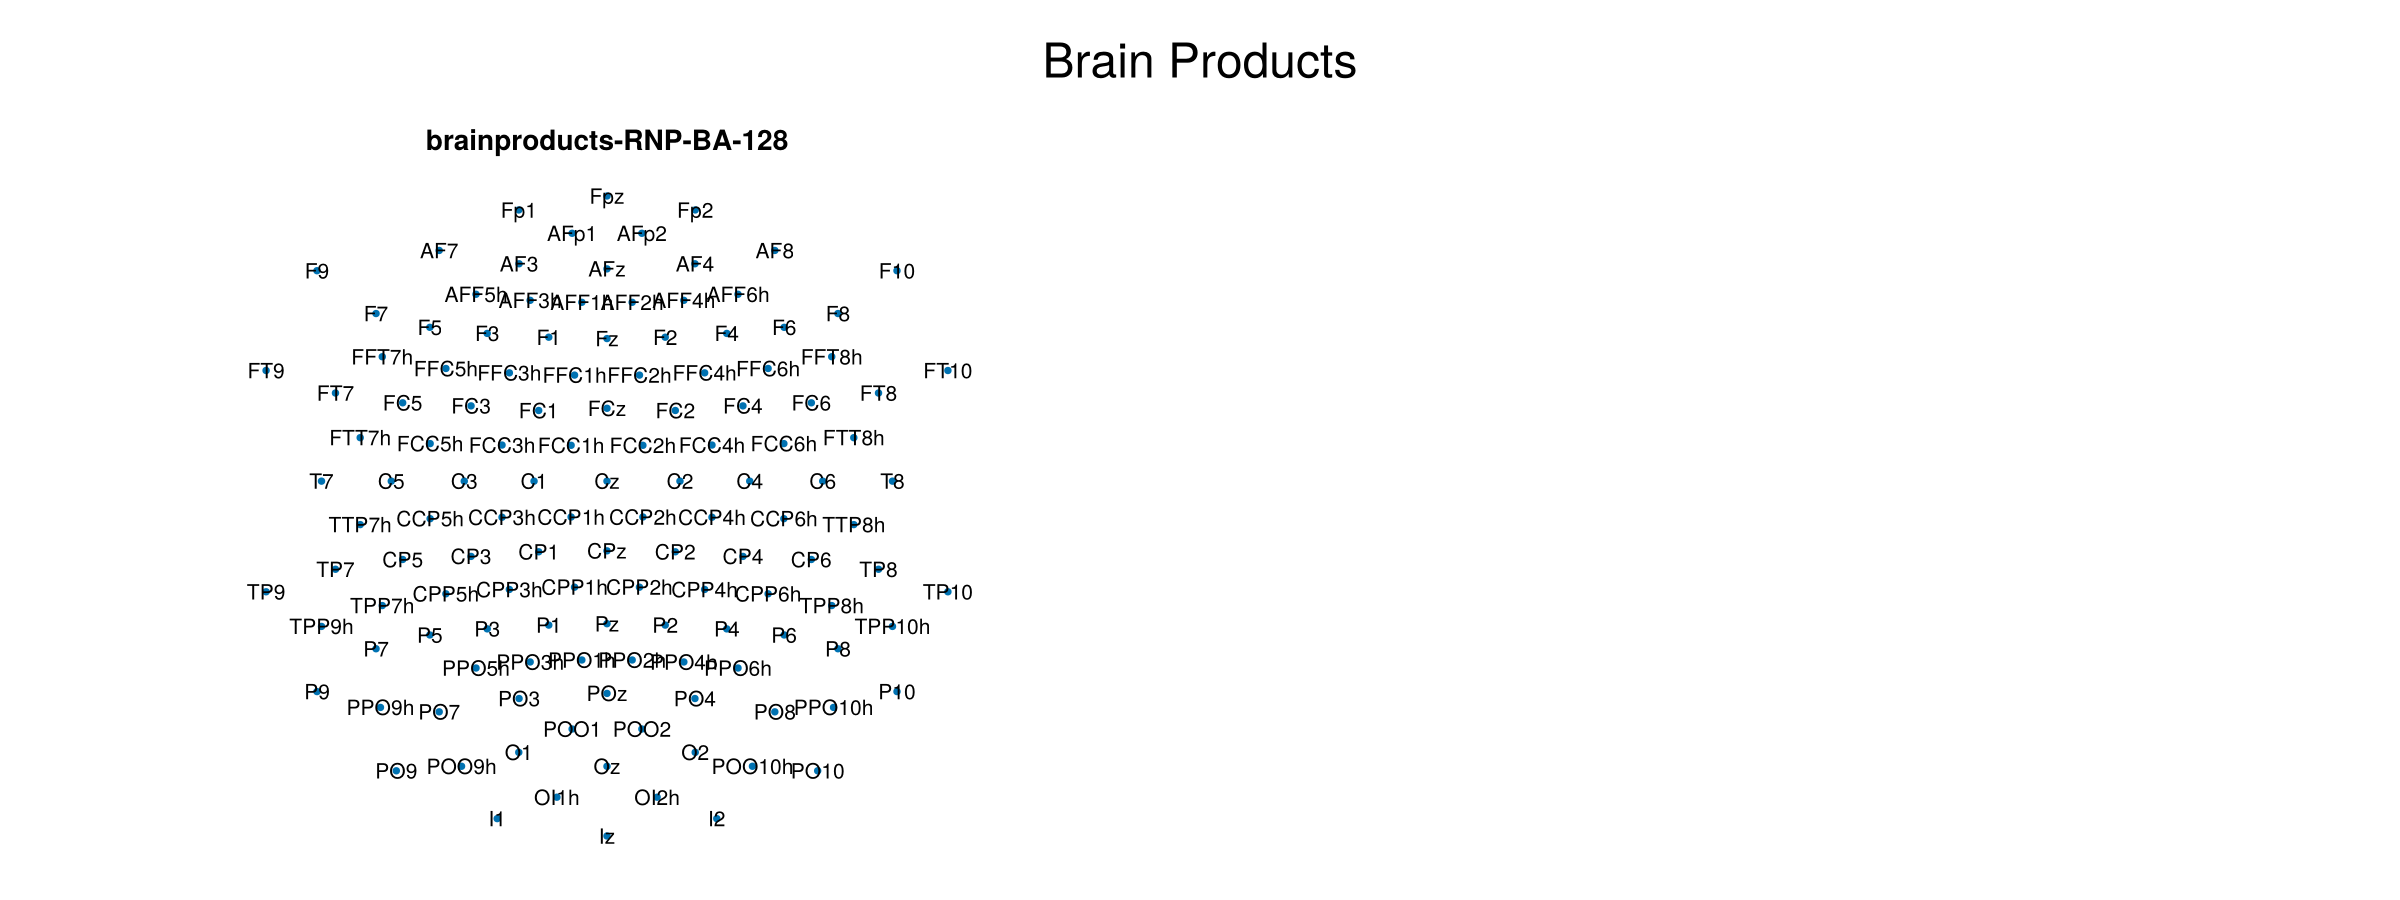
EGI montage
plot_montage_group("EGI", egi)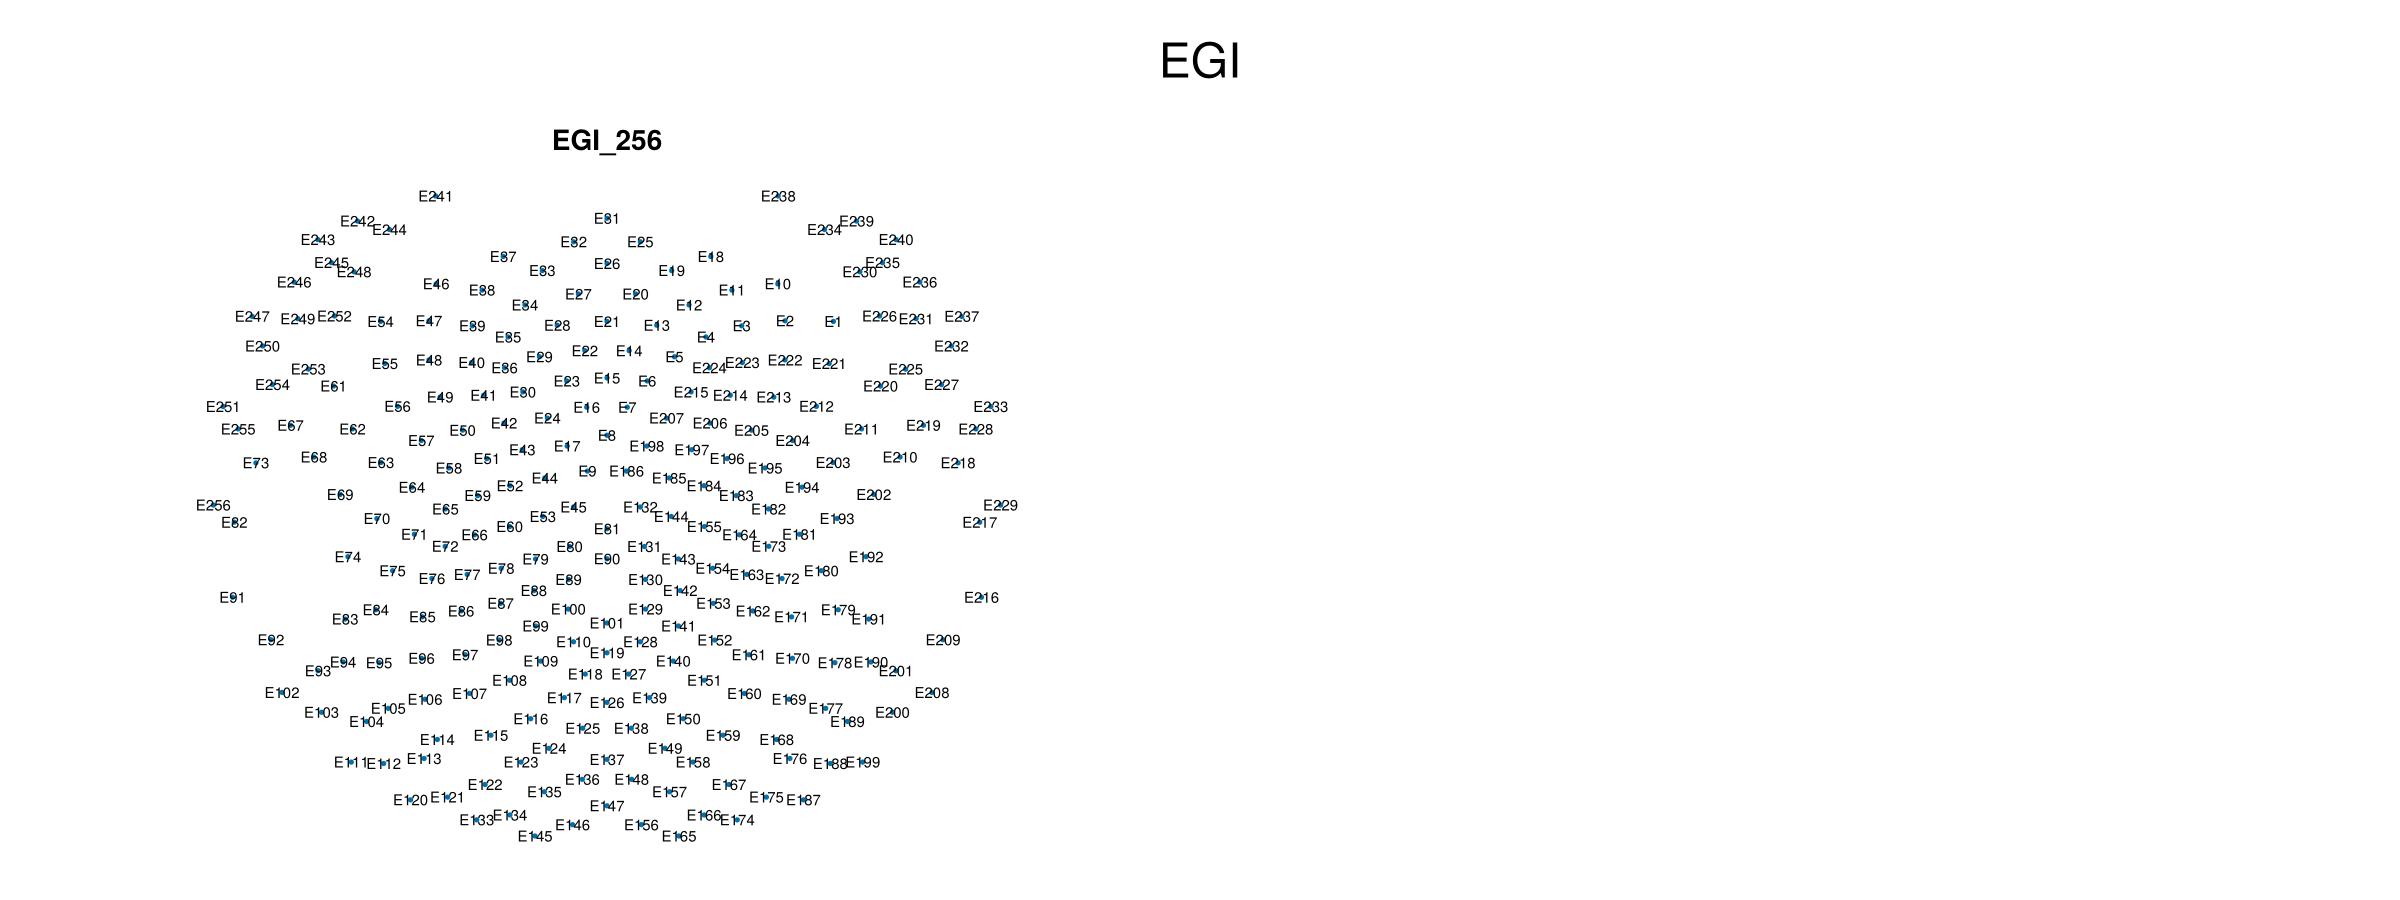
Use a montage in a topoplot
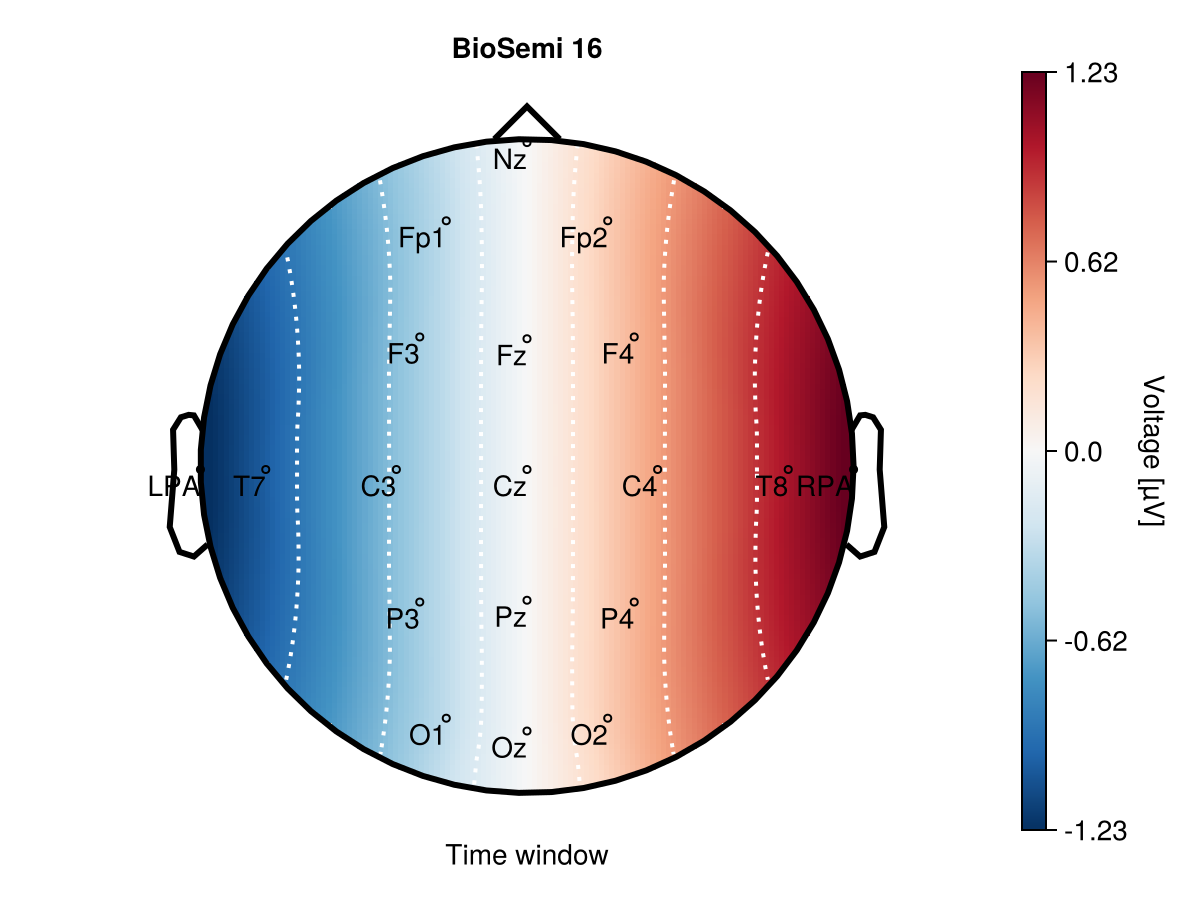
get_montage returns labels and positions in the same channel order. The data vector passed to plot_topoplot must follow that order as well. Here we use a simple synthetic left-to-right gradient for the BioSemi 16 montage.
montage = get_montage("biosemi16")
values = first.(montage.positions) # could be any vector of length 16

plot_topoplot(
    values;
    positions = montage.positions,
    labels = montage.labels,
    axis = (; title = "BioSemi 16", xlabel = "Time window"),
    visual = (; label_text = true),
)
Use a subset of standard positions
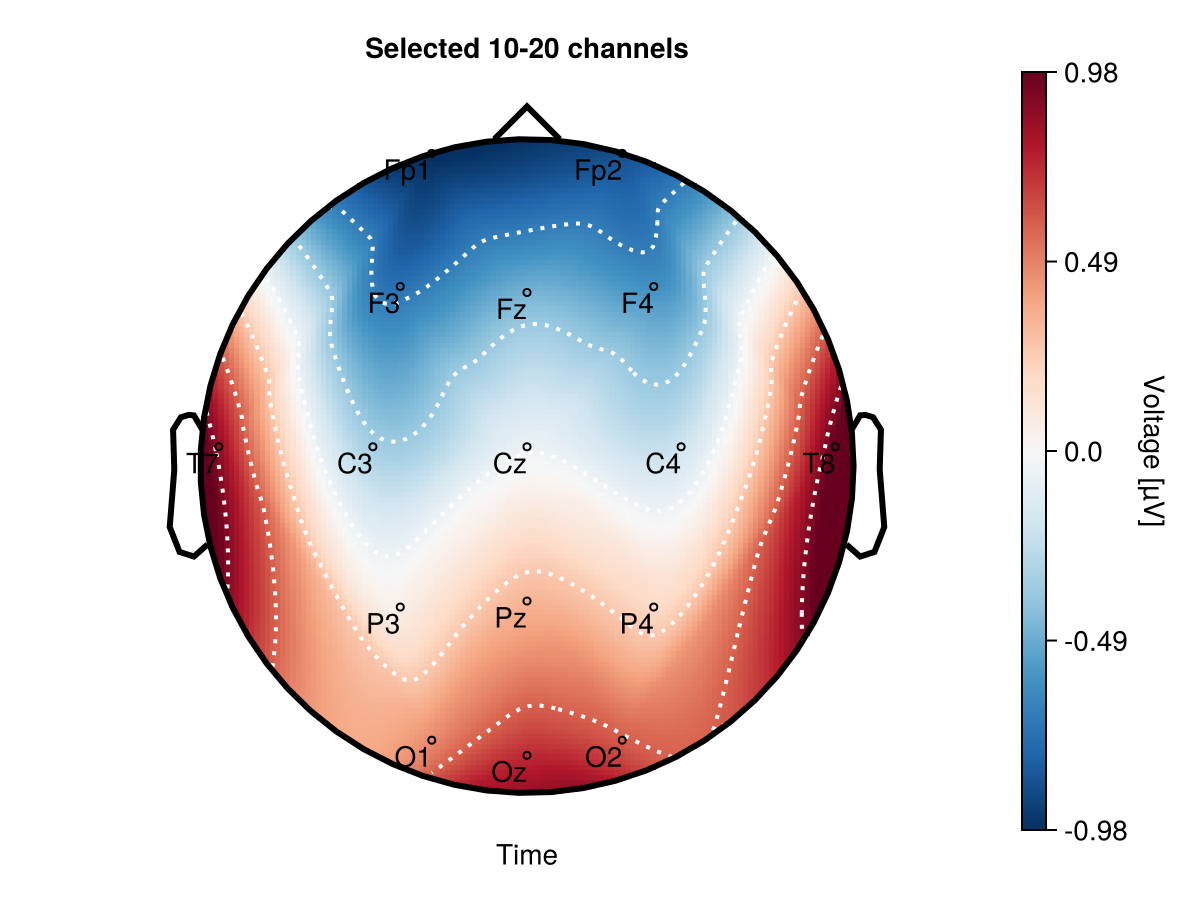
When a dataset contains only some channels, standard_positions retrieves their positions from a bundled montage. Matching is case-insensitive, and the returned positions follow the order of selected_labels.
selected_labels = ["Fp1", "Fp2", "F3", "F4", "Fz", "C3", "C4", "Cz",
    "P3", "P4", "Pz", "O1", "O2", "Oz", "T7", "T8"]
selected_positions = standard_positions(selected_labels, "standard_1020")
selected_values = collect(range(-1, 1; length = length(selected_labels)))

plot_topoplot(
    selected_values;
    positions = selected_positions,
    labels = selected_labels,
    axis = (; title = "Selected 10-20 channels"),
    visual = (; label_text = true),
)
Use a custom montage
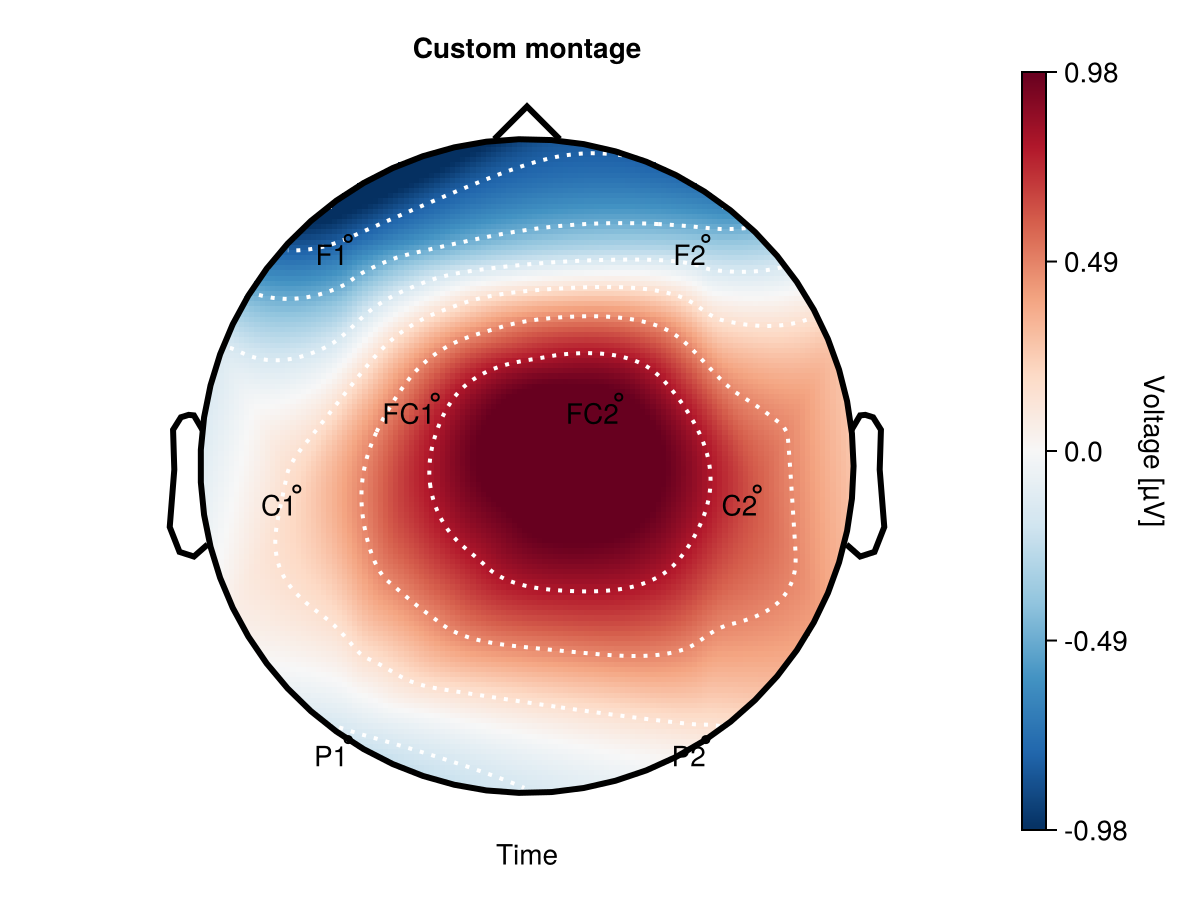
A montage does not have to be bundled with UnfoldMakie. If electrode locations are available as 3D Cartesian coordinates, to_positions projects them onto the 2D layout used by plot_topoplot. The input matrix must have three rows (x, y, and z) and one column per channel. Its columns, custom_labels, and custom_values must all use the same channel order.
custom_labels = ["F1", "F2", "C1", "C2", "P1", "P2", "FC1", "FC2"]
custom_positions_3d = [
    -0.5  0.5 -0.7  0.7 -0.5  0.5 -0.3  0.3
     0.7  0.7  0.0  0.0 -0.7 -0.7  0.3  0.3
     0.5  0.5  0.7  0.7  0.5  0.5  0.9  0.9
]
3×8 Matrix{Float64}:
-0.5 0.5 -0.7 0.7 -0.5 0.5 -0.3 0.3
0.7 0.7 0.0 0.0 -0.7 -0.7 0.3 0.3
0.5 0.5 0.7 0.7 0.5 0.5 0.9 0.9to_positions can modify its input while translating the sphere origin, so use copy when the original 3D coordinates need to be retained.
custom_positions_2d = to_positions(copy(custom_positions_3d))
custom_values = [-0.8, -0.4, 0.2, 0.6, -0.2, 0.1, 0.7, 1.0]

plot_topoplot(
    custom_values;
    positions = custom_positions_2d,
    labels = custom_labels,
    axis = (; title = "Custom montage"),
    visual = (; label_text = true),
)
Use a montage in a topoplot series
montage = get_montage("biosemi128")
montage_data = [
    x * cos(2π * time / 100) for x in first.(montage.positions), time in 1:100
]
montage_df = eeg_array_to_dataframe(montage_data, montage.labels);
Plot one time point to verify the BioSemi 128 electrode and label positions.
plot_topoplotseries(
    montage_df;
    bin_num = 4, nrows = 2,
    positions = montage.positions,
    labels = montage.labels,
    axis = (; xlabel = "Time windows [s]"),
    visual = (; label_text = (; align = (:center, :center))),
)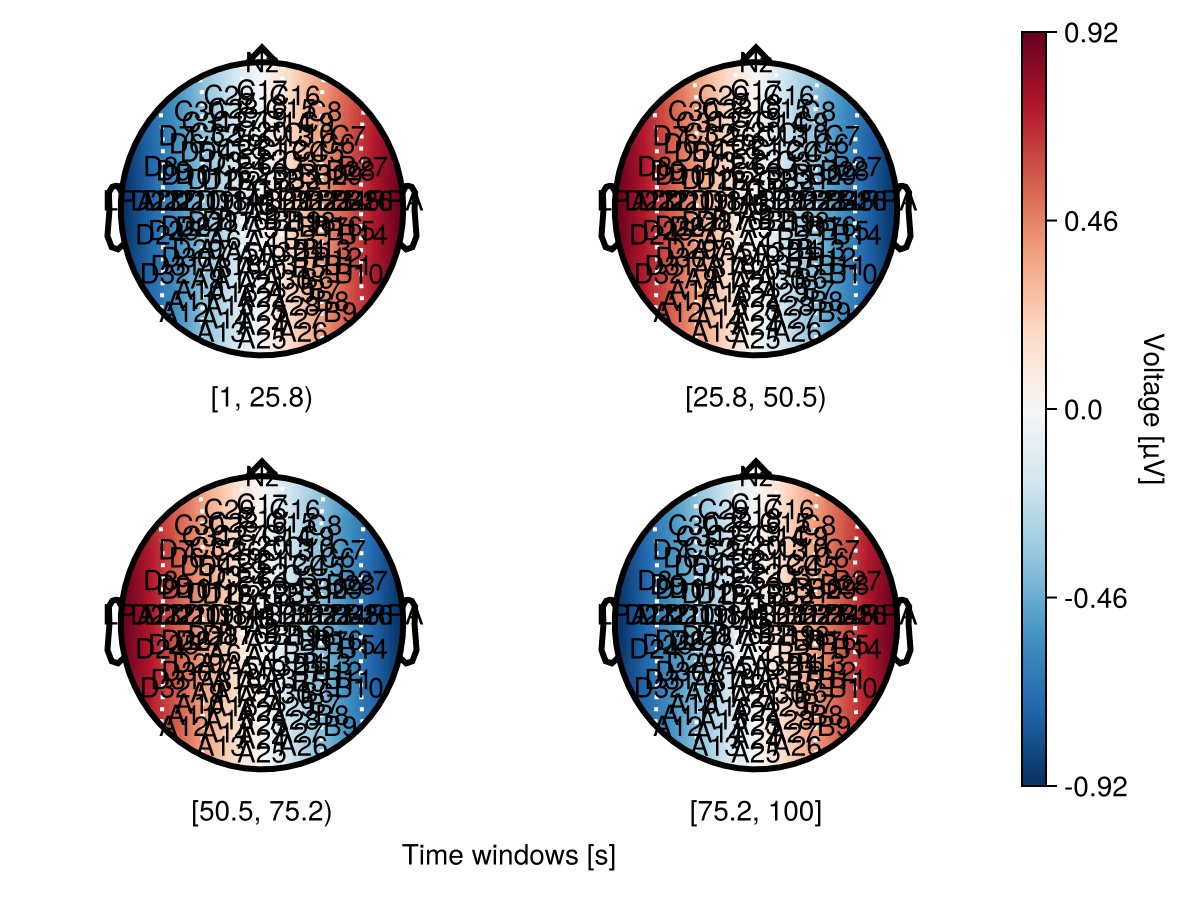
For larger montages, center-align the channel labels to place each label directly on its electrode position. This will help to avoids a systematic lower-left offset. Use visual = (; label_text = (; align = (:center, :center))).
This page was generated using Literate.jl.