Change Butterfly Channel Position Color
This section discusses how users can change the color scheme of the butterfly plot. It will affect the colors of the lines and markers on the inserted topoplot.
using UnfoldMakie
using CairoMakie
using DataFramesMeta
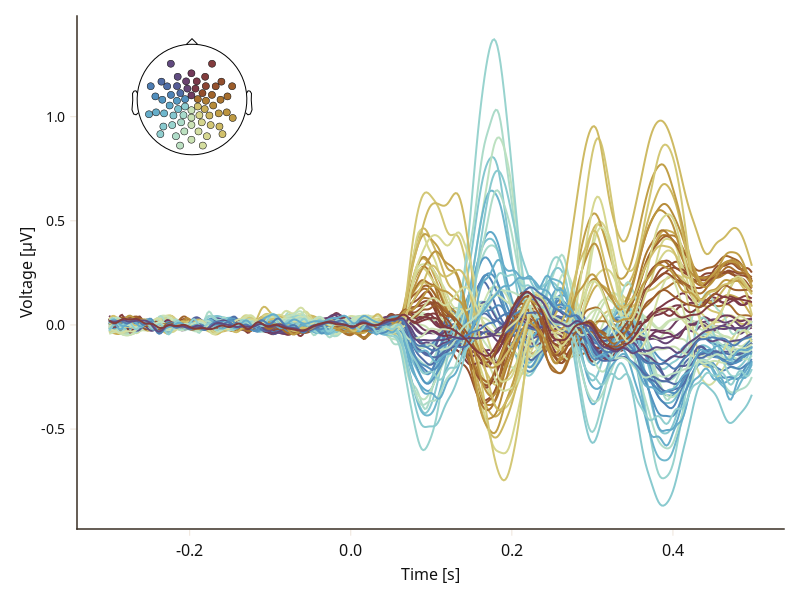
using ColorsBy default the plot looks like this:
include("../../../example_data.jl")
results, positions = example_data("TopoPlots.jl")
plot_butterfly(results; positions = positions)

#=
We can change the color scale by specifying a function that maps from an `(x,y)` tuple to a color. UnfoldMakie currently provides three different color scales:
- `pos2colorRGB` (same as MNE-Python),
- pos2colorHSV` (HSV color space),
- pos2colorRomaO`.

While `RGB` & `HSV` have the advantage of being 2D color maps, `Roma0` has the advantage of being perceptually uniform.
=#
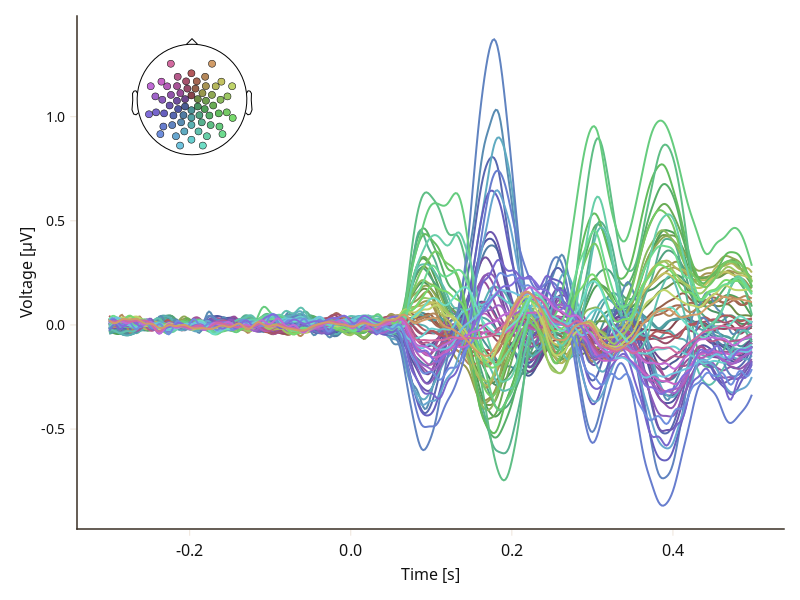
MNE-like color scheme
plot_butterfly(
    results;
    positions = positions,
    topopositions_to_color = pos -> UnfoldMakie.posToColorRGB(pos),
)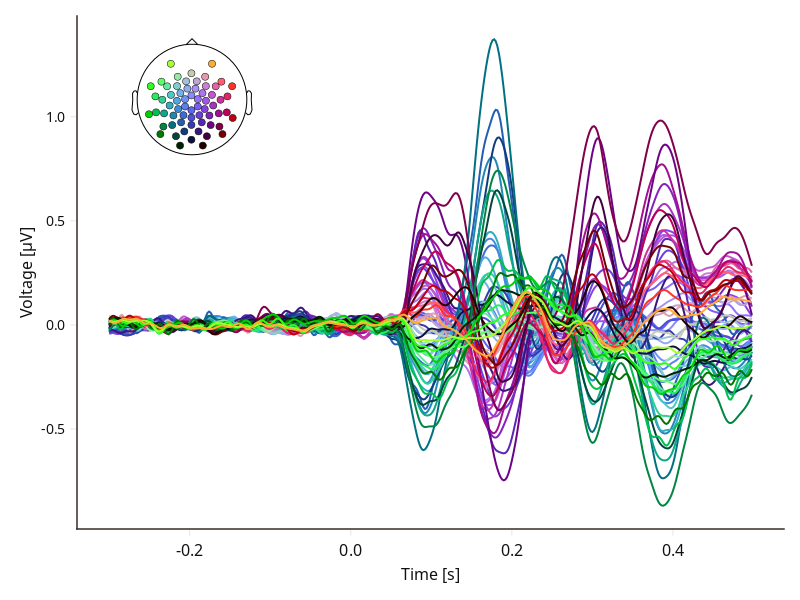
HSV-Space
plot_butterfly(
    results;
    positions = positions,
    topopositions_to_color = UnfoldMakie.posToColorHSV,
)
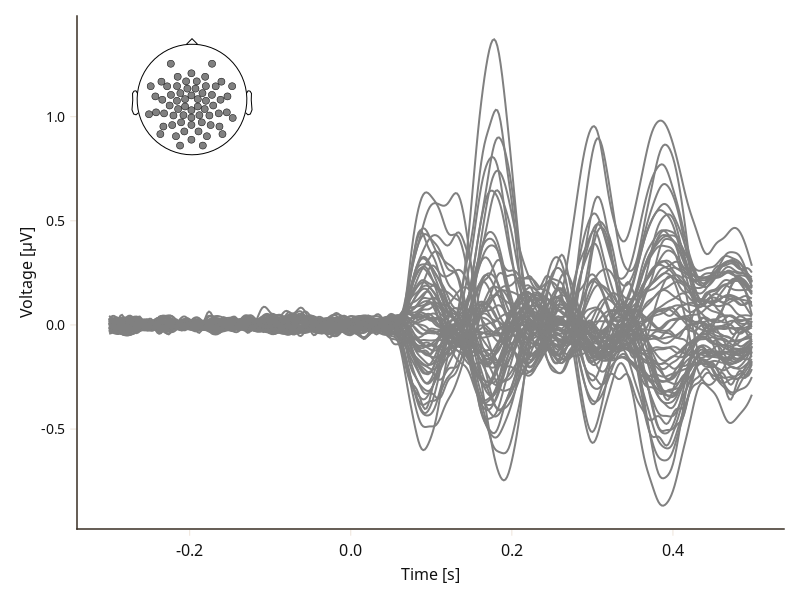
Uniform Color
We can also make all lines "gray", or any other arbitrary color, or function of electrode "position".
plot_butterfly(
    results;
    positions = positions,
    topopositions_to_color = x -> Colors.RGB(0.5),
)
This page was generated using Literate.jl.