Circular Topoplot Arrangement
Package loading
using UnfoldMakie
using CairoMakie
using TopoPlots # for example data
using Random
using DataFrames
Generate data
Generate a Dataframe. We need to specify the Topoplot positions either via position, or via labels (according to TopoPlots.jl)
data, pos = TopoPlots.example_data();
dat = data[:, 240, 1]
df = DataFrame(
    :estimate => eachcol(Float64.(data[:, 100:40:300, 1])),
    :circular_variable => [0, 50, 80, 120, 180, 210],
    :time => 100:40:300,
)
df = flatten(df, :estimate);
Our first plot!
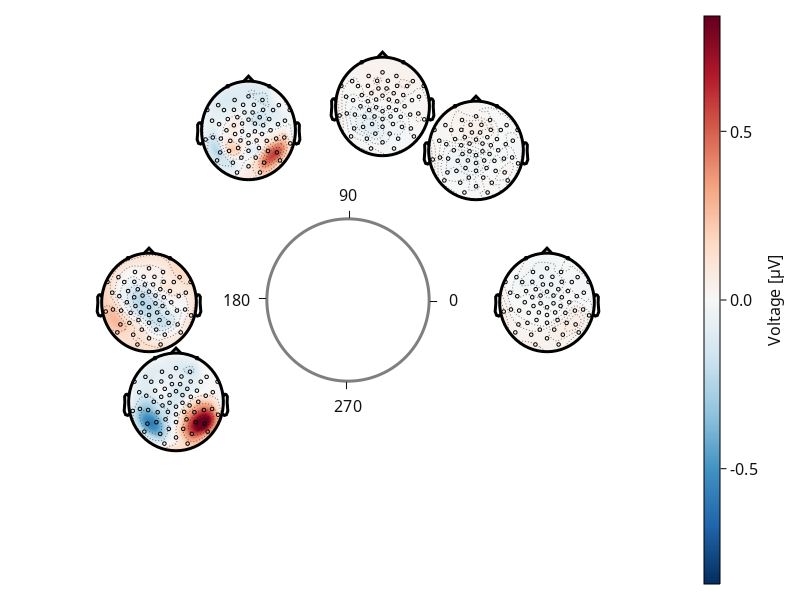
note how the plots are at the angles of circular_variable`
plot_circulareegtopoplot(
    df;
    positions = pos,
    axis = (; label = "Incoming saccade"),
    predictor = :circular_variable,
)
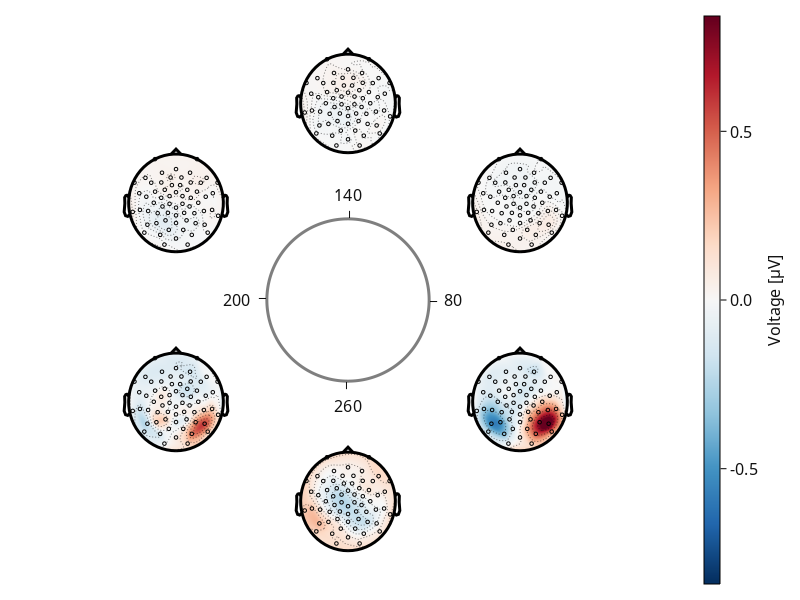
If the bounding variable is not between 0 and 360, since we are using time, we must specify it.
plot_circulareegtopoplot(
    df;
    positions = pos,
    axis = (; label = "Time?!"),
    predictor = :time,
    predictor_bounds = [80, 320],
)
Configurations of Circular EEG Plot
UnfoldMakie.plot_circulareegtopoplot — Functionplot_circulareegtopoplot!(f, data::DataFrame; kwargs...)
plot_circulareegtopoplot(data::DataFrame; kwargs...)Plot a circular EEG topoplot.
Arguments:
f::Union{GridPosition, GridLayout, Figure}: Figure, GridLayout or GridPosition that the plot should be drawn intodata::DataFrame: DataFrame with keys for data (looks for:y, :yhat, :estimate), and :position (looks for:pos, :position, :positions),predictor(optional; default:predictor): the circular predictor value, defines position of topoplot, is mapped aroundpredictor_boundspredictor_bounds(default:[0,360]): the bounds of the predictor. This is relevant for the axis labels.positions(default:nothing): positions for theplot_topoplotcenter_label(default: ""): the text in the center of the criclelabels(default:nothing): labels for theplot_topoplotkwargs...: additional styling behavior, see below.
Shared plot configuration options
The shared plot options can be used as follows: type = (; key=value, ...)) - for example plot_x(...; layout = (; show_legend=true, legend_position=:right)). Multiple defaults will be cycled until match.
figure = NamedTuple() - use kwargs... of Makie.Figure
axis = (xlabel = "", aspect = Makie.DataAspect(), label = "") - use kwargs... of Makie.Axis
layout = (show_legend = false, legend_position = :right, xlabelFromMapping = nothing, ylabelFromMapping = nothing, use_colorbar = true, hidespines = (), hidedecorations = Dict{Symbol, Bool}(:label => 0))
mapping = (x = (nothing,), y = (:estimate, :yhat, :y), positions = (:pos, :positions, :position, nothing), labels = (:labels, :label, :sensor, nothing))
visual = (colormap = Makie.Reverse{Symbol}(:RdBu), contours = (color = :white, linewidth = 2), label_scatter = true, label_text = true, bounding_geometry = GeometryBasics.Circle) - use kwargs... of $Topoplot.eeg_topoplot$
legend = (orientation = :vertical, tellwidth = true, tellheight = false) - use kwargs... of Makie.Legend
colorbar = (vertical = true, tellwidth = true, tellheight = false, flipaxis = true, labelrotation = -1.5707963267948966, label = "Voltage [µV]", colormap = Makie.Reverse{Symbol}(:RdBu)) - use kwargs... of Makie.Colorbar
Return Value:
A figure containing the circular topoplot at given layout position
This page was generated using Literate.jl.