Here we discuss ERP image visualization. Make sure you have looked into the installation instructions.
Package loading
using Unfold
using UnfoldMakie
using CairoMakie
using UnfoldSim
include("../../../example_data.jl")
example_data (generic function with 2 methods)Plot ERP image
The following code will result in the default configuration.
data, evts = UnfoldSim.predef_eeg(; noiselevel = 10, return_epoched = true)
plot_erpimage(data)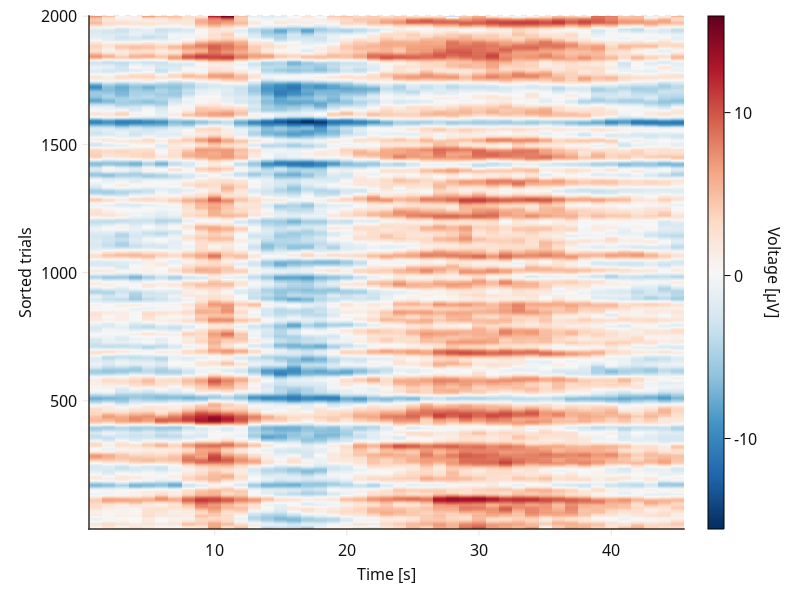
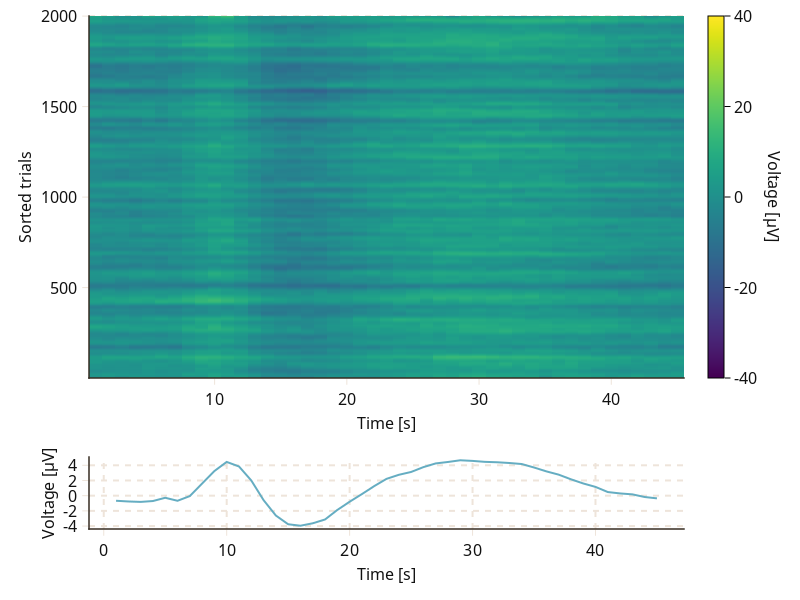
Additional features
Since ERP images use a Matrix as an input, the library does not need any informations about the mapping.
erpblur(Number,10): number indicating how much blur is applied to the image; Gaussian blur of the ImageFiltering module is used. Non-Positive values deactivate the blur.meanplot(bool,false): Indicating whether the plot should add a line plot below the ERP image, showing the mean of the data.
plot_erpimage(
    data;
    meanplot = true,
    colorbar = (label = "Voltage [µV]",),
    visual = (colormap = :viridis, colorrange = (-40, 40)),
)
Sorted ERP image
First, generate a data. Second, specify the necessary sorting parameter.
sortvalues(bool,false): parameter over which plot will be sorted. Using sortperm() of Base Julia.sortperm()computes a permutation of the array's indices that puts the array into sorted order.
dat_e, evts, times = example_data("sort_data")
plot_erpimage(times, dat_e; sortvalues = evts.Δlatency)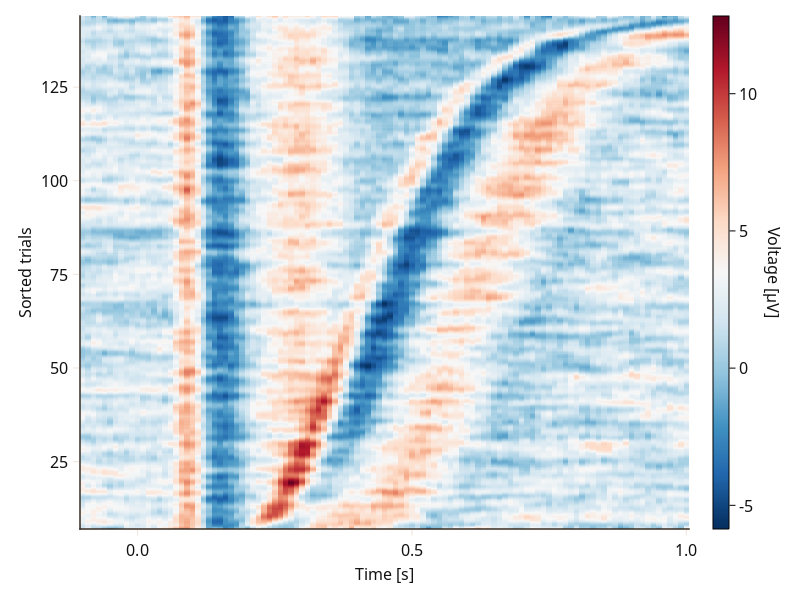
Configurations for ERP image
UnfoldMakie.plot_erpimage — Functionplot_erpimage!(f::Union{GridPosition, GridLayout, Figure}, data::Matrix{Float64}; kwargs...)
plot_erpimage(data::Matrix{Float64}; kwargs...)Plot an ERP image.
Arguments:
f::Union{GridPosition, GridLayout, Figure}: Figure or GridPosition that the plot should be drawn intoplot::Matrix{Float64}: Data for the plot visualization
Keyword Arguments
erpblur(Number; default:10): number indicating how much blur is applied to the image. Gaussian blur of the ImageFiltering module is used. Non-Positive values deactivate the blur.sortindex(Vector{Int64}; default:nothing): sorting over index values.sortvalues(Vector{Int64}; default:false): parameter over which plot will be sorted. Using sortperm() of Base Julia.- sortperm() computes a permutation of the array's indices that puts the array into sorted order.
meanplot(bool; default:false): Indicating whether the plot should add a line plot below the ERP image, showing the mean of the data.
Shared plot configuration options
The shared plot options can be used as follows: type = (; key=value, ...)) - for example plot_x(...; layout = (; show_legend=true, legend_position=:right)). Multiple defaults will be cycled until match.
figure = NamedTuple() - use kwargs... of Makie.Figure
axis = (xlabel = "Time [s]", ylabel = "Sorted trials") - use kwargs... of Makie.Axis
layout = (show_legend = true, legend_position = :right, xlabelFromMapping = :x, ylabelFromMapping = :y, use_colorbar = true)
mapping = (x = (:time,), y = (:estimate, :yhat, :y))
visual = (colormap = Makie.Reverse{String}("RdBu"),) - use kwargs... of $Makie.heatmap$
legend = (orientation = :vertical, tellwidth = true, tellheight = false) - use kwargs... of Makie.Legend
colorbar = (vertical = true, tellwidth = true, tellheight = false, label = "Voltage [µV]", labelrotation = 4.7) - use kwargs... of Makie.Colorbar
Return Value:
The input f
This page was generated using Literate.jl.