Here we discuss design matrix visualization. Make sure you have looked into the installation instructions section.
Package loading
using Unfold
using UnfoldMakie
using DataFrames
using CairoMakie

# Data

include("../../../example_data.jl")
uf = example_data("UnfoldLinearModel")

# Plot Designmatrices
Unfold-Type: UnfoldLinearModel
formula: Dict{DataType, Tuple{StatsModels.FormulaTerm{StatsModels.ConstantTerm{Int64}, Tuple{StatsModels.ConstantTerm{Int64}, StatsModels.Term, StatsModels.Term}}, StepRangeLen{Float64, Base.TwicePrecision{Float64}, Base.TwicePrecision{Float64}, Int64}}}(Any => (0 ~ 1 + condition + continuous, 0.0:0.01:0.44))
Useful functions:
design(uf) (returns Dict of event => (formula,times/basis))
designmatrix(uf) (returns DesignMatrix with events)
modelfit(uf) (returns modelfit object)
coeftable(uf) (returns tidy result dataframe)
The following code will result in the default configuration.
plot_designmatrix(designmatrix(uf))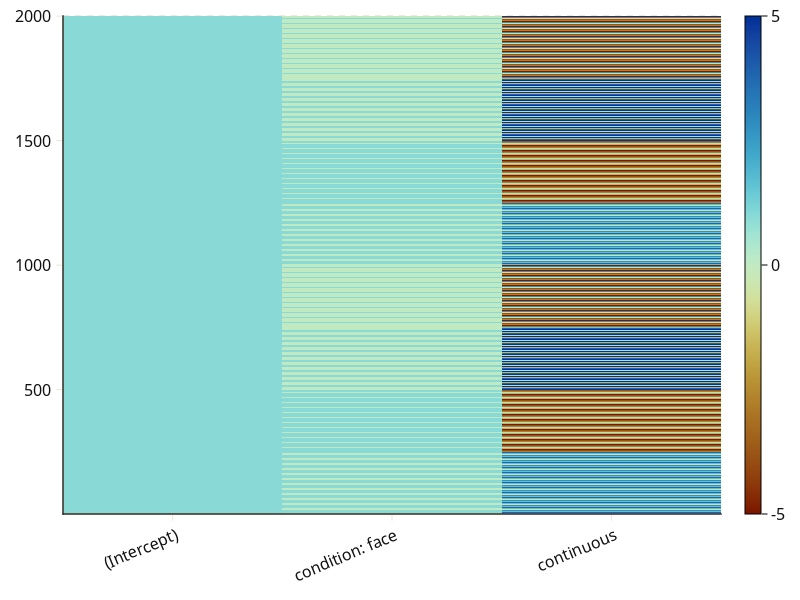
To make the design matrix easier to read, you may want to sort it using sort_data.
plot_designmatrix(designmatrix(uf); sort_data = true)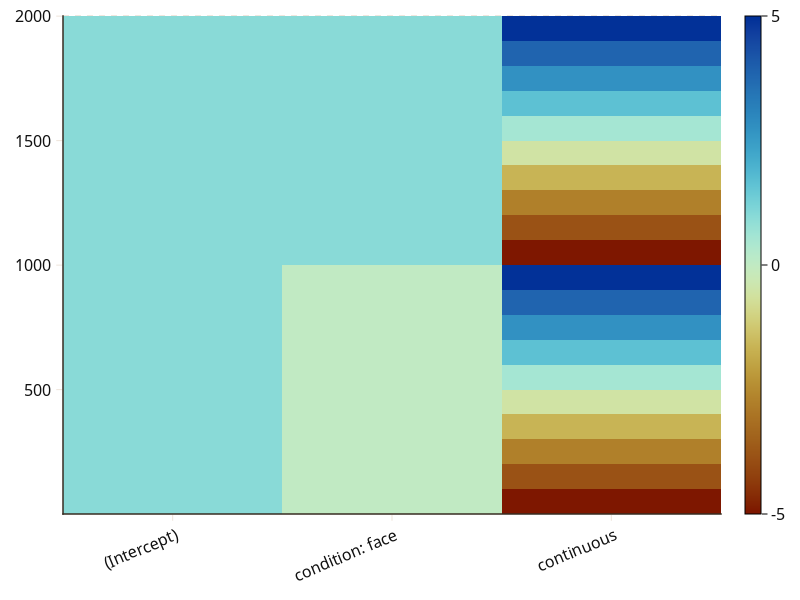
Configurations for Design matrix plot
UnfoldMakie.plot_designmatrix — Functionplot_designmatrix!(f::Union{GridPosition, GridLayout, Figure}, data::Unfold.DesignMatrix; kwargs...)
plot_designmatrix(data::Unfold.DesignMatrix; kwargs...)Plot a designmatrix.
Arguments:
f::Union{GridPosition, GridLayout, Figure}: Figure or GridPosition (e.g. f[2, 3]) in which the plot will be placed into. A new axis is created.data::Unfold.DesignMatrix: data for the plot visualization.
kwargs
standardize_data(bool, default:true): indicates whether the data is standardized by pointwise division of the data with its sampled standard deviation.sort_data(bool, default:true): indicates whether the data is sorted; using sortslices() of Base Julia.xticks(Num,default:nothing): returns the number of labels on the x-axis. Behavior is set in the configuration:xticks= 0: no labels are placed.xticks= 1: first possible label is placed.xticks= 2: first and last possible labels are placed.- 2 <
xticks<number of labels: equally distribute the labels. xticks≥number of labels: all labels are placed.
Shared plot configuration options
The shared plot options can be used as follows: type = (; key=value, ...)) - for example plot_x(...; layout = (; show_legend=true, legend_position=:right)). Multiple defaults will be cycled until match.
figure = NamedTuple() - use kwargs... of Makie.Figure
axis = (xticklabelrotation = 0.39269908169872414,) - use kwargs... of Makie.Axis
layout = (show_legend = true, legend_position = :right, xlabelFromMapping = nothing, ylabelFromMapping = nothing, use_colorbar = true)
mapping = (x = (:time,), y = (:estimate, :yhat, :y))
visual = (colormap = :roma,) - use kwargs... of $Makie.heatmap$
legend = (orientation = :vertical, tellwidth = true, tellheight = false) - use kwargs... of Makie.Legend
colorbar = (vertical = true, tellwidth = true, tellheight = false) - use kwargs... of Makie.Colorbar
Return Value:
A figure displaying the designmatrix.
This page was generated using Literate.jl.