Package loading
using Unfold
using UnfoldMakie
using DataFrames
using CairoMakie
using TopoPlots
using Statistics
Plot Topoplot Series
Example data
In case you do not already have data, you can get example data from the TopoPlots module. You can do it like this:
data, positions = TopoPlots.example_data()
df = UnfoldMakie.eeg_matrix_to_dataframe(data[:, :, 1], string.(1:length(positions)));
Plotting
Δbin = 80
plot_topoplotseries(df, Δbin; positions = positions)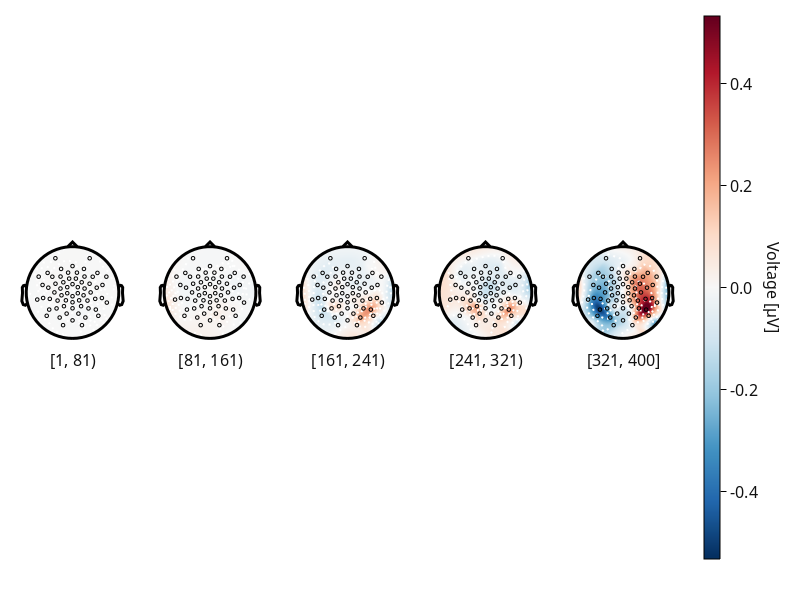
Additional features
Disabling colorbar
plot_topoplotseries(df, Δbin; positions = positions, layout = (; use_colorbar = false))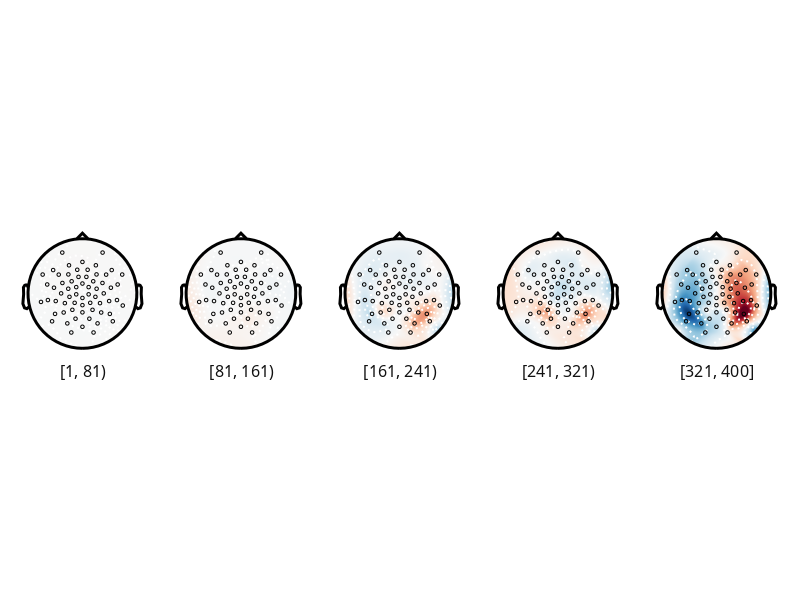
Aggregating functions
In this example combinefun is specified by mean, median and std.
f = Figure()
plot_topoplotseries!(f[1, 1], df, Δbin; positions = positions, combinefun = mean)
plot_topoplotseries!(f[2, 1], df, Δbin; positions = positions, combinefun = median)
plot_topoplotseries!(f[3, 1], df, Δbin; positions = positions, combinefun = std)
f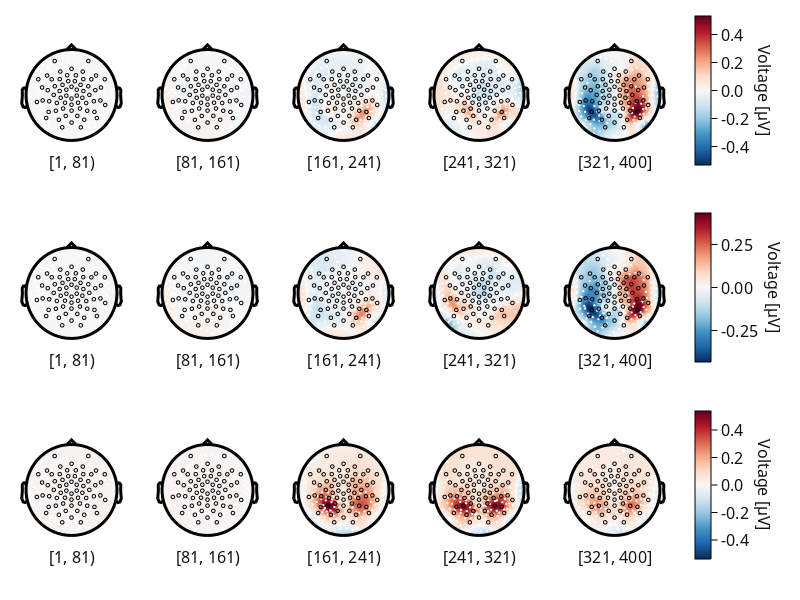
Configurations of Topoplot series
UnfoldMakie.plot_topoplotseries — Functionplot_topoplotseries(f::Union{GridPosition, GridLayout, Figure}, data::DataFrame, Δbin::Real; kwargs...)
plot_topoplotseries!(data::DataFrame, Δbin::Real; kwargs...)Multiple miniature topoplots in regular distances
Arguments:
f::Union{GridPosition, GridLayout, Figure}: Figure, GridLayout or GridPosition that the plot should be drawn into.data::DataFrame: DataFrame with data, needs atimecolumn.Δbin::Real: A number for how large one time bin should be. Δbin is in units of thedata.timecolumn.combinefun(default:mean) - specify how the samples withinΔbinare summarised. possible functons:mean,median,std.rasterize_heatmaps(default:true) - enforce rasterization of the plot heatmap when saving in svg format. This has the benefit that all lines/points are vectors, except the interpolated heatmap. This is typically what you want, otherwise you get ~500x500 vectors per topoplot, which makes everything super slow.col_labels,row_labels- shows column and row labels.labels(default:nothing) - channel labels.positions(default:nothing) - channel positions.
Shared plot configuration options
The shared plot options can be used as follows: type = (; key=value, ...)) - for example plot_x(...; layout = (; show_legend=true, legend_position=:right)). Multiple defaults will be cycled until match.
figure = NamedTuple() - use kwargs... of Makie.Figure
axis = (xlabel = "", aspect = Makie.DataAspect()) - use kwargs... of Makie.Axis
layout = (show_legend = true, legend_position = :right, xlabelFromMapping = nothing, ylabelFromMapping = nothing, use_colorbar = true, hidespines = (), hidedecorations = Dict{Symbol, Bool}(:label => 0))
mapping = (x = (nothing,), y = (:estimate, :yhat, :y), positions = (:pos, :positions, :position, nothing), labels = (:labels, :label, :sensor, nothing), col = (:time,), row = (nothing,))
visual = (colormap = Makie.Reverse{Symbol}(:RdBu), contours = (color = :white, linewidth = 2), label_scatter = true, label_text = false, bounding_geometry = GeometryBasics.Circle) - use kwargs... of $Topoplot.eeg_topoplot$
legend = (orientation = :vertical, tellwidth = true, tellheight = false) - use kwargs... of Makie.Legend
colorbar = (vertical = true, tellwidth = true, tellheight = false, flipaxis = true, labelrotation = -1.5707963267948966, label = "Voltage [µV]") - use kwargs... of Makie.Colorbar
Return Value:
The input f
This page was generated using Literate.jl.