Line Plot Visualization
Here we discuss ERP plot visualization. Make sure you have looked into the installation instructions.
Package loading
The following modules are necessary for following this tutorial:
using Unfold
using UnfoldMakie
using DataFrames
using CairoMakie
using DataFramesMeta
using UnfoldSim
using UnfoldMakie
include("../../../example_data.jl")
example_data (generic function with 2 methods)Setup
Let's generate some data. We'll fit a model with a 2 level categorical predictor and a continuous predictor with interaction.
data, evts = UnfoldSim.predef_eeg(; noiselevel = 12, return_epoched = true)
data = reshape(data, (1, size(data)...))
f = @formula 0 ~ 1 + condition + continuous
se_solver = (x, y) -> Unfold.solver_default(x, y, stderror = true);

m = fit(
    UnfoldModel,
    Dict(Any => (f, range(0, step = 1 / 100, length = size(data, 2)))),
    evts,
    data,
    solver = se_solver,
)
results = coeftable(m)
res_effects = effects(Dict(:continuous => -5:0.5:5), m);
┌ Warning: Autocorrelation was NOT taken into account. Therefore SE are UNRELIABLE. Use at your own discretion
└ @ Unfold ~/.julia/packages/Unfold/qdR2Q/src/solver.jl:77Plot the results
plot_erp(results; :stderror => true)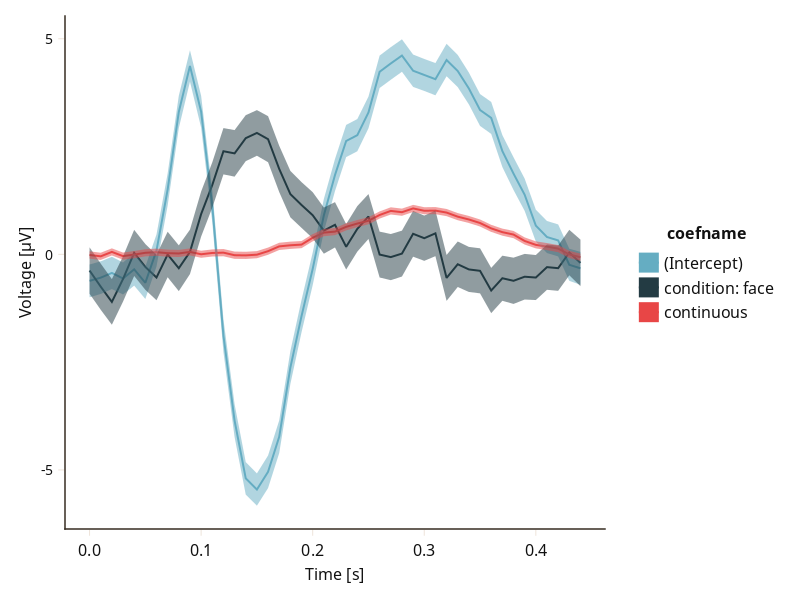
Column Mappings for Line Plots
plot_erp use a DataFrame as an input, the library needs to know the names of the columns used for plotting.
There are multiple default values, that are checked in that order if they exist in the DataFrame, a custom name can be chosen using plot_erp(...; mapping=(; :y=:my_estimate)
:x Default is (:x, :time). :y Default is (:y, :estimate, :yhat). :color Default is (:color, :coefname).
Configuration for Line Plots
key values
plot_erp(...; <name>=<value>,...).
- categorical_color (boolean, true) - in case of numeric
:colorcolumn, treat:coloras continuous or categorical variable. - categorical_group (boolean, true) - in case of numeric
:groupcolumn, treat:groupas categorical variable by default. topolegend(bool,false): add an inlay topoplot with corresponding electrodes.stderror(bool,false): add an error ribbon, with lower and upper limits based on the:stderrorcolumn.pvalue(Array,[]): show a pvalue (see below).
Using some general configurations we can pretty up the default visualization. Here we use the following configuration:
plot_erp(
    res_effects;
    mapping = (; y = :yhat, color = :continuous, group = :continuous),
    legend = (; nbanks = 2),
    layout = (; show_legend = true, legend_position = :right),
    categorical_color = false,
    categorical_group = true,
)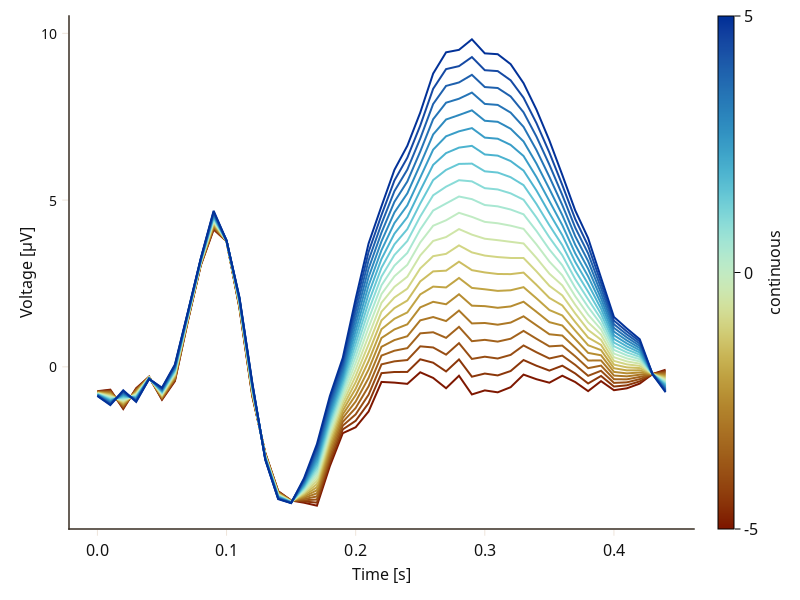
In the following we will use this "pretty" line plot as a basis for looking into configuration options.
pvalue (array)
Is an array of p-values. If array not empty, plot shows colored lines under the plot representing the p-values. Default is [] (an empty array). Below is an example in which pvalue are given:
m = example_data("UnfoldLinearModel")
results = coeftable(m)
pvals = DataFrame(
    from = [0.1, 0.3],
    to = [0.5, 0.7],
    coefname = ["(Intercept)", "condition: face"], # if coefname not specified, line should be black
)
plot_erp(results; :pvalue => pvals)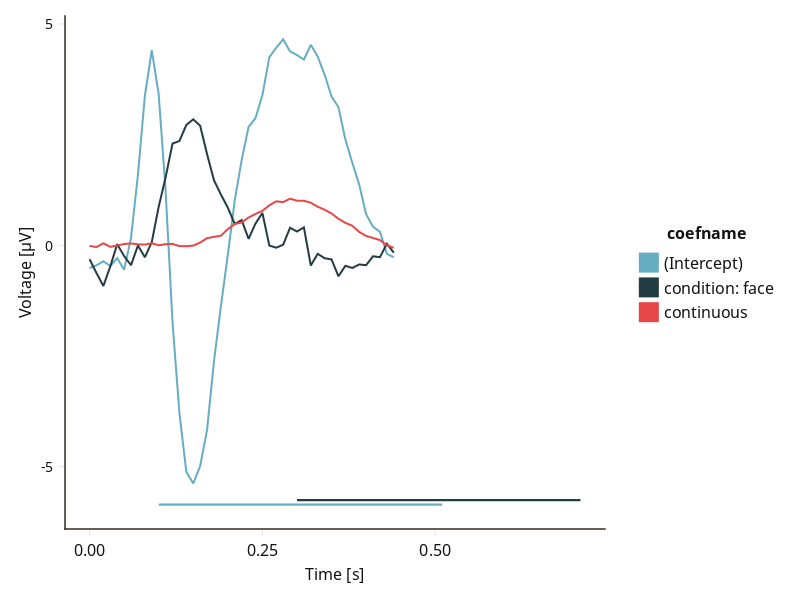
stderror (boolean)
Indicating whether the plot should show a colored band showing lower and higher estimates based on the stderror. Default is false.
previously we showed :stderror- but low/high is possible as well`
results.se_low = results.estimate .- 0.5
results.se_high = results.estimate .+ 0.15
plot_erp(select(results, Not(:stderror)); stderror = true)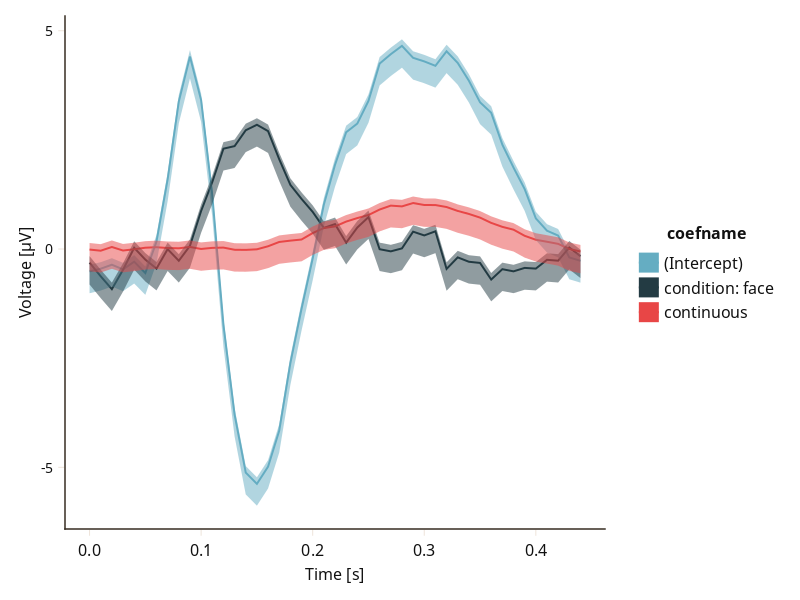
as in the above code,:stderror has precedence over :se_low/:se_high
Configurations of ERP plot
UnfoldMakie.plot_erp — Functionplot_erp!(f::Union{GridPosition, GridLayout, Figure}, plot_data::DataFrame; kwargs...)
plot_erp(plot_data::DataFrame; kwargs...)Plot an ERP plot.
Arguments:
f::Union{GridPosition, GridLayout, Figure}: Figure, GridLayout or GridPosition that the plot should be drawn into.plot_data::DataFrame: Data for the line plot visualization.kwargs...: Additional styling behavior. Often used:plot_erp(df; mapping=(; color=:coefname, col=:conditionA)).
kwargs (...; ...):
categorical_color(bool, default=true): in case of numeric:colorcolumn, treat:coloras continuous or categorical variable.categorical_group(bool, default=true): in case of numeric:groupcolumn, treat:groupas categorical variable by default.stderror(bool, default=false): add an error ribbon, with lower and upper limits based on the:stderrorcolumn.pvalue(Array, default=[]): show a pvalue.- example:
DataFrame(from=[0.1, 0.3], to=[0.5, 0.7], coefname=["(Intercept)", "condition:face"])- if coefname is not specified, the lines will be black.
- example:
positions(Array, default=[]): see plot_butterfly.topolegend(bool, default=false): (seeplot_butterfly).
Internal-use only:
butterfly(bool, default=true): a butterfly plot instead of an ERP plot. Seeplot_butterfly
Shared plot configuration options
The shared plot options can be used as follows: type = (; key=value, ...)) - for example plot_x(...; layout = (; show_legend=true, legend_position=:right)). Multiple defaults will be cycled until match.
figure = NamedTuple() - use kwargs... of Makie.Figure
axis = (xlabel = "Time [s]", ylabel = "Voltage [µV]", yticklabelsize = 14) - use kwargs... of Makie.Axis
layout = (show_legend = true, legend_position = :right, xlabelFromMapping = :x, ylabelFromMapping = :y, use_colorbar = false, hidespines = (:r, :t), hidedecorations = Dict{Symbol, Bool}(:grid => 1, :label => 0, :ticks => 0, :ticklabels => 0))
mapping = (x = (:time,), y = (:estimate, :yhat, :y), color = (:color, :coefname, nothing))
visual = (colormap = :roma,) - use kwargs... of $Makie.lines$
legend = (orientation = :vertical, tellwidth = true, tellheight = false, framevisible = false) - use kwargs... of Makie.Legend
colorbar = (vertical = true, tellwidth = true, tellheight = false) - use kwargs... of AlgebraOfGraphics.colobar!
Return Value:
- f - Figure() or the inputed
f
This page was generated using Literate.jl.