Here we discuss topo plot visualization. Make sure you have looked into the installation instructions.
# Package loading

using Unfold
using UnfoldMakie
using DataFrames
using CairoMakie
using TopoPlots
using DataFrames
Plot Topo Plots
Providing the Data
data, positions = TopoPlots.example_data()(Float32[0.020321019 0.017548025 … -0.01600543 -0.01283471; 0.0031529826 -0.0015369694 … 0.0435155 0.042441286; … ; 0.019118542 0.018276842 … -0.0016676243 0.000102287915; 0.019761175 0.015906857 … 0.11238504 0.10997909;;; 0.12287474 0.12434518 … 0.26227304 0.2553188; 0.07275557 0.07255436 … 0.30493587 0.30125305; … ; 0.06405158 0.06326836 … 0.2052622 0.2037698; 0.07259608 0.07544017 … 0.2627769 0.25834358;;; 0.26609147 0.2966399 … 0.40829125 0.4242154; 0.43455398 0.46788654 … 0.29459625 0.29695213; … ; 0.13350745 0.14102341 … 0.48767123 0.4992381; 0.15481107 0.21390781 … 0.059936017 0.06072311], Point{2, Float32}[[0.49371386, 0.5440313], [0.5630452, 0.50400287], [0.5630452, 0.4239459], [0.49371386, 0.38391745], [0.4243825, 0.4239459], [0.4243825, 0.50400287], [0.5378472, 0.6178857], [0.61455333, 0.56901854], [0.6522695, 0.4862579], [0.6388263, 0.39630732] … [0.93907887, 0.6439135], [0.9450873, 0.29968786], [0.8333667, 0.12432156], [0.61803544, 1.9428903f-16], [0.3693923, 2.7755576f-17], [0.15406103, 0.12432156], [0.029739477, 0.3396528], [0.04834886, 0.6439135], [0.26820713, 0.88809085], [0.7192206, 0.88809085]])We select one datapoint, and the first enry of dimension 3 (the mean estimate, the others are p-value and std)
plot_topoplot(data[:, 340, 1]; positions = positions)

df = DataFrame(:estimate => data[:, 340, 1])
plot_topoplot(df; positions = positions)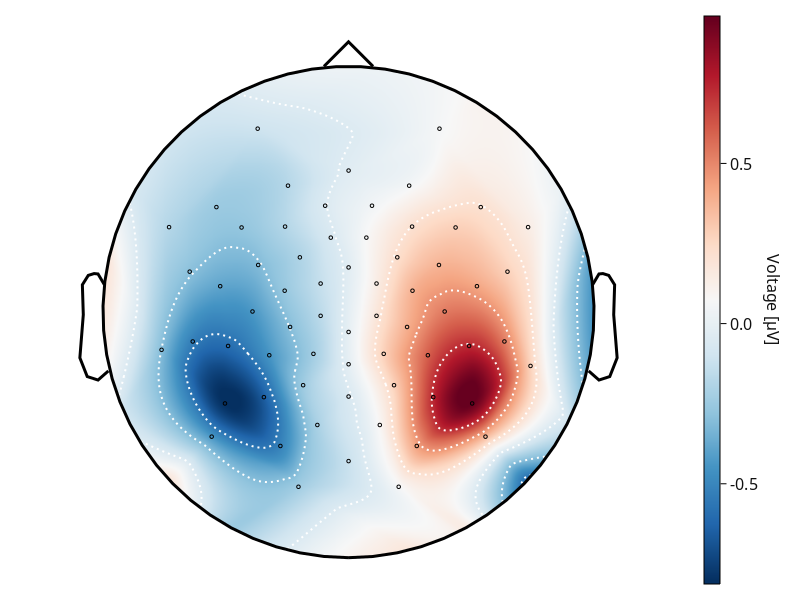
Setting Sensor Positions
Since the topo plot needs the positions of the sensors they have to be put into the drawing function. But there are multiple options (In order of prioritization):
- Giving the positions directly:
plot_topoplot(...; positions=[...]) - Giving the labels of the sensors:
plot_topoplot(...; labels=[...])
To get the positions from the labels we use a database.
Column Mappings for Topoplots
When using topoplots with a DataFrame as input, the library needs to know the names of the columns used for plotting. This is specified using the mapping=(;) kwargs.
While there are several default values that will be checked in order if they exist in the DataFrame, a custom name may need to be chosen:
Note that only one of positions or labels needs to be set to draw a topoplot. If both are set, positions takes precedence, labels can be used to label electrodes in TopoPlots.jl.
The default columns of mapping could be seen usign this code:
cfgDefault = UnfoldMakie.PlotConfig()
cfgDefault.mapping.y
(:estimate, :yhat, :y)Labelling
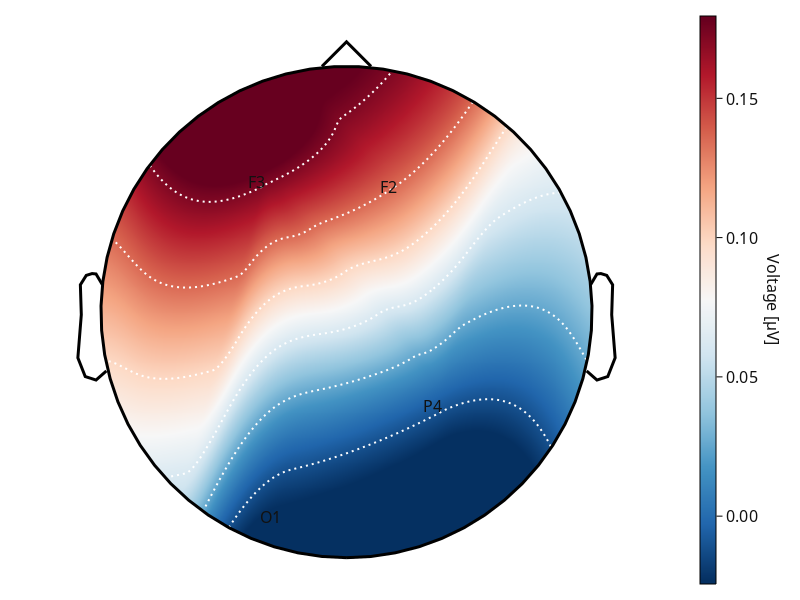
label_text draws labels next to their positions. Example: plot_topoplot(...; visual=(; label_text=true))
label_scatter (boolean) draws the markers at the given positions.
Example: plot_topoplot(...; visual=(; label_scatter=true))
plot_topoplot(
    data[1:4, 340, 1];
    visual = (; label_scatter = false),
    labels = ["O1", "F2", "F3", "P4"],
)
Configurations of Topoplot
UnfoldMakie.plot_topoplot — Functionplot_topoplot!(f::Union{GridPosition, GridLayout, Figure}, data, ; positions=nothing, labels=nothing, kwargs...)
plot_topoplot(data; positions=nothing, labels=nothing, kwargs...)Plot a topo plot.
Arguments:
f::Union{GridPosition, GridLayout, Figure}: Figure, GridLayout or GridPosition that the plot should be drawn into.data::Union{DataFrame, Vector{Float32}}: data for the plot visualization.positions::Vector{Point{2, Float32}}=nothing: positions used ifdatais not a DataFrame. If this is the case andpositions=nothingthen positions are generated fromlabels.labels::Vector{String} = nothing: labels used ifdatais not a DataFrame.
Shared plot configuration options
The shared plot options can be used as follows: type = (; key=value, ...)) - for example plot_x(...; layout = (; show_legend=true, legend_position=:right)). Multiple defaults will be cycled until match.
figure = NamedTuple() - use kwargs... of Makie.Figure
axis = (xlabel = "", aspect = Makie.DataAspect()) - use kwargs... of Makie.Axis
layout = (show_legend = true, legend_position = :right, xlabelFromMapping = nothing, ylabelFromMapping = nothing, use_colorbar = true, hidespines = (), hidedecorations = Dict{Symbol, Bool}(:label => 0))
mapping = (x = (nothing,), y = (:estimate, :yhat, :y), positions = (:pos, :positions, :position, nothing), labels = (:labels, :label, :sensor, nothing))
visual = (colormap = Makie.Reverse{Symbol}(:RdBu), contours = (color = :white, linewidth = 2), label_scatter = true, label_text = true, bounding_geometry = GeometryBasics.Circle) - use kwargs... of $Topoplot.eeg_topoplot$
legend = (orientation = :vertical, tellwidth = true, tellheight = false) - use kwargs... of Makie.Legend
colorbar = (vertical = true, tellwidth = true, tellheight = false, flipaxis = true, labelrotation = -1.5707963267948966, label = "Voltage [µV]") - use kwargs... of Makie.Colorbar
Return Value:
A figure displaying the topo plot.
This page was generated using Literate.jl.