Parallel Coordinates Plot Here we discuss parallel coordinates plot (PCP) visualization.
Package loading
using Unfold
using UnfoldMakie
using DataFrames
using CairoMakie
Data generation
include("../../../example_data.jl")
r1, positions = example_data();
r2 = deepcopy(r1)
r2.coefname .= "B" # create a second category
r2.estimate .+= rand(length(r2.estimate)) * 0.1
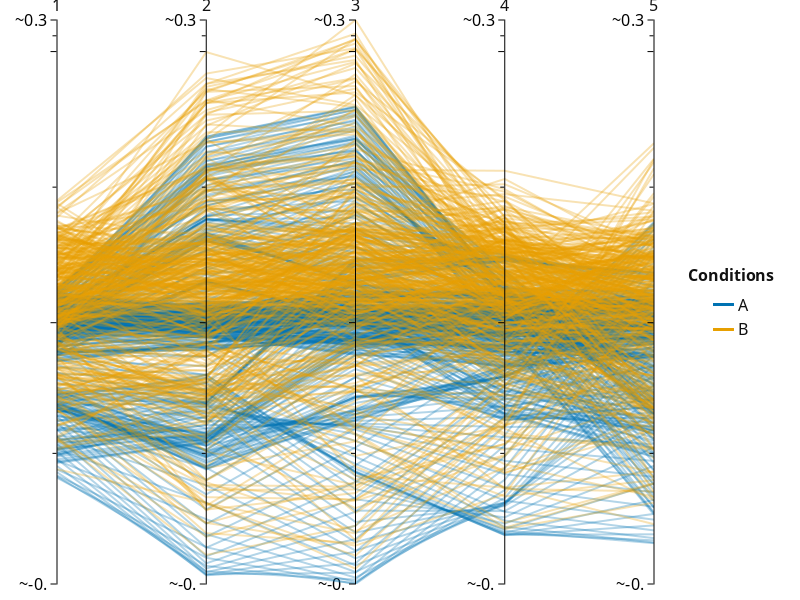
results_plot = vcat(r1, r2);Plot PCPs
plot_parallelcoordinates(
    subset(results_plot, :channel => x -> x .<= 5);
    mapping = (; color = :coefname),
)
Additional features
Normalization
On the first image, there is no normalization and the extremes of all axes are the same and equal to the max and min values across all chanells. On the second image, there is a minmax normalization`, so each axis has its own extremes based on the min and max of the data.
Typically, parallelplots are normalized per axis. Whether this makes sense for estimating channel x, we do not know.
f = Figure()
plot_parallelcoordinates(
    f[1, 1],
    subset(results_plot, :channel => x -> x .< 10);
    mapping = (; color = :coefname),
)
plot_parallelcoordinates(
    f[2, 1],
    subset(results_plot, :channel => x -> x .< 10);
    mapping = (; color = :coefname),
    normalize = :minmax,
)
for (label, layout) in zip(["no normalisation", "minmax normalisation"], [f[1, 1], f[2, 1]])
    Label(
        layout[1, 1, TopLeft()],
        label,
        fontsize = 26,
        font = :bold,
        padding = (0, -250, 25, 0),
        halign = :left,
    )
end
f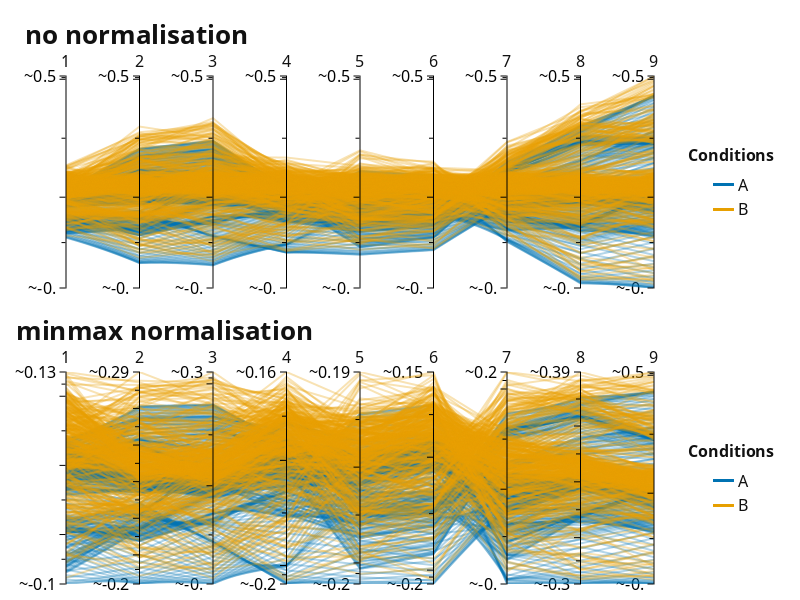
Color schemes
Use only categorical with high contrast between adjacent colors. More: https://docs.makie.org/stable/explanations/colors/index.html
f = Figure()
plot_parallelcoordinates(
    f[1, 1],
    subset(results_plot, :channel => x -> x .<= 5);
    mapping = (; color = :coefname),
    visual = (; colormap = :tab10),
)
plot_parallelcoordinates(
    f[2, 1],
    subset(results_plot, :channel => x -> x .<= 5);
    mapping = (; color = :coefname),
    visual = (; colormap = :Accent_3),
)
for (label, layout) in zip(["tab10", "Accent_3"], [f[1, 1], f[2, 1]])
    Label(
        layout[1, 1, TopLeft()],
        label,
        fontsize = 26,
        font = :bold,
        padding = (0, -50, 25, 0),
        halign = :left,
    )
end
f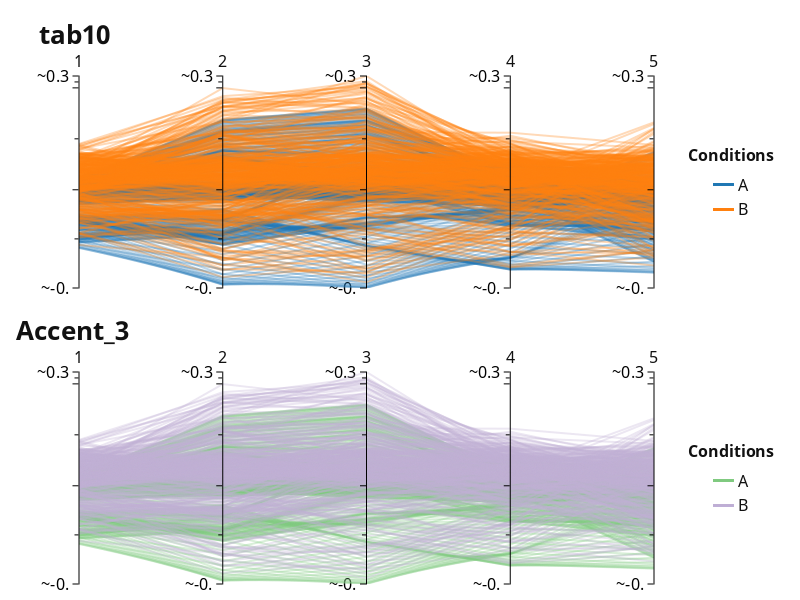
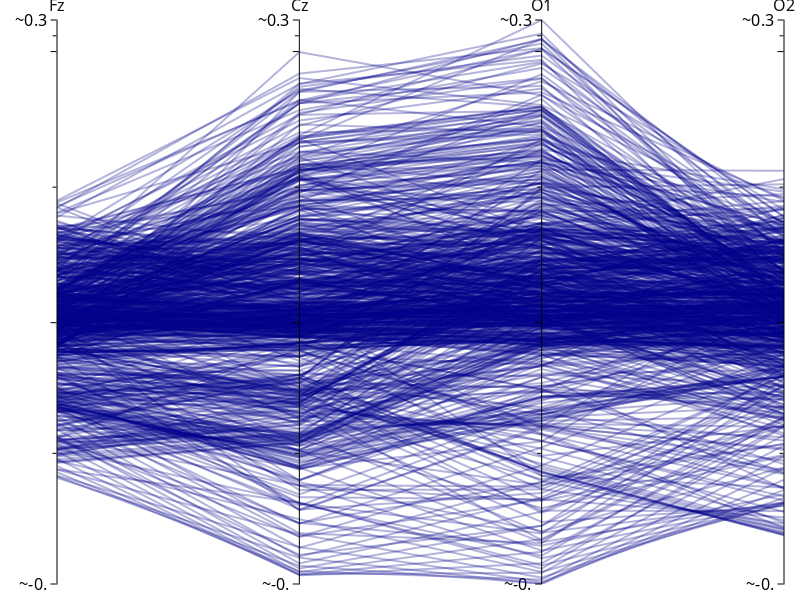
Labels
Use ax_labels to specify labels for the axes.
plot_parallelcoordinates(
    subset(results_plot, :channel => x -> x .< 5);
    visual = (; color = :darkblue),
    ax_labels = ["Fz", "Cz", "O1", "O2"],
)
Tick labels
Specify tick labels on axis. There are four different options for the tick labels.
f = Figure(resolution = (400, 800))
plot_parallelcoordinates(
    f[1, 1],
    subset(results_plot, :channel => x -> x .< 5, :time => x -> x .< 0);
    ax_labels = ["Fz", "Cz", "O1", "O2"],
    ax_ticklabels = :all,
    normalize = :minmax,
) # show all ticks on all axes
plot_parallelcoordinates(
    f[2, 1],
    subset(results_plot, :channel => x -> x .< 5, :time => x -> x .< 0);
    ax_labels = ["Fz", "Cz", "O1", "O2"],
    ax_ticklabels = :left,
    normalize = :minmax,
) # show all ticks on the left axis, but only extremities on others
plot_parallelcoordinates(
    f[3, 1],
    subset(results_plot, :channel => x -> x .< 5, :time => x -> x .< 0);
    ax_labels = ["Fz", "Cz", "O1", "O2"],
    ax_ticklabels = :outmost,
    normalize = :minmax,
) # show ticks on extremities of all axes

plot_parallelcoordinates(
    f[4, 1],
    subset(results_plot, :channel => x -> x .< 5, :time => x -> x .< 0);
    ax_labels = ["Fz", "Cz", "O1", "O2"],
    ax_ticklabels = :none,
    normalize = :minmax,
) #  disable all ticks
for (label, layout) in
    zip(["all", "left", "outmost", "none"], [f[1, 1], f[2, 1], f[3, 1], f[4, 1]])
    Label(
        layout[1, 1, TopLeft()],
        label,
        fontsize = 26,
        font = :bold,
        padding = (0, -80, 25, 0),
        halign = :left,
    )
end
f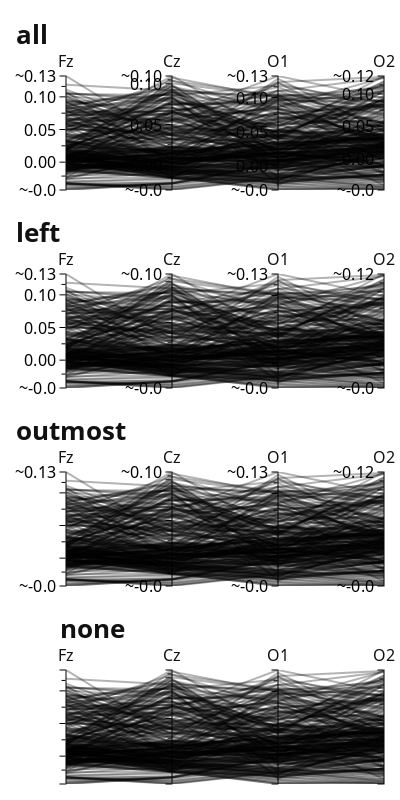
Bending the parallel plot
Bending the linescan be helpful to make them more visible.
f = Figure()
plot_parallelcoordinates(f[1, 1], subset(results_plot, :channel => x -> x .< 10))
plot_parallelcoordinates(
    f[2, 1],
    subset(results_plot, :channel => x -> x .< 10),
    bend = true,
)
f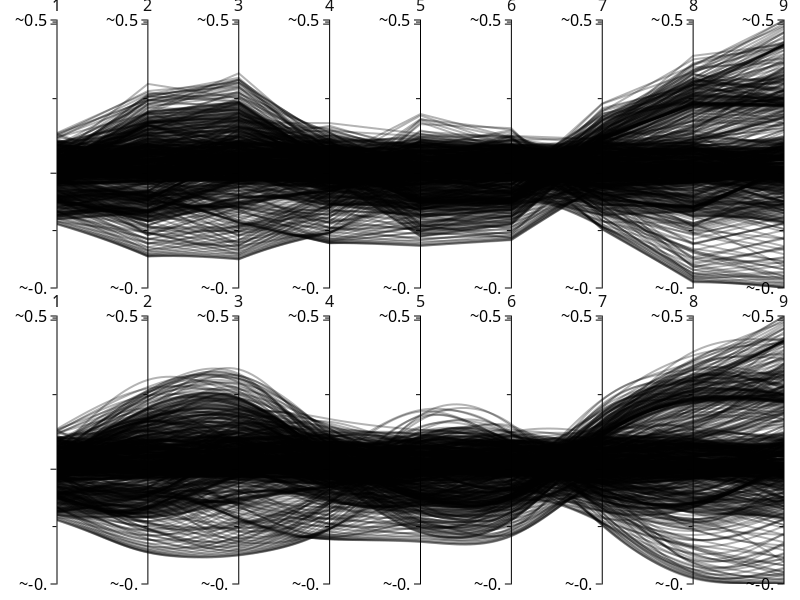
Transparancy
uf_5chan = example_data("UnfoldLinearModelMultiChannel")

f = Figure()
plot_parallelcoordinates(
    f[1, 1],
    uf_5chan;
    mapping = (; color = :coefname),
    layout = (; legend_position = :right),
    visual = (; alpha = 0.1),
)
plot_parallelcoordinates(
    f[2, 1],
    uf_5chan,
    mapping = (; color = :coefname),
    layout = (; legend_position = :right),
    visual = (; alpha = 0.9),
)
for (label, layout) in zip(["alpha = 0.1", "alpha = 0.9"], [f[1, 1], f[2, 1]])
    Label(
        layout[1, 1, TopLeft()],
        label,
        fontsize = 26,
        font = :bold,
        padding = (0, -80, 25, 0),
        halign = :left,
    )
end
f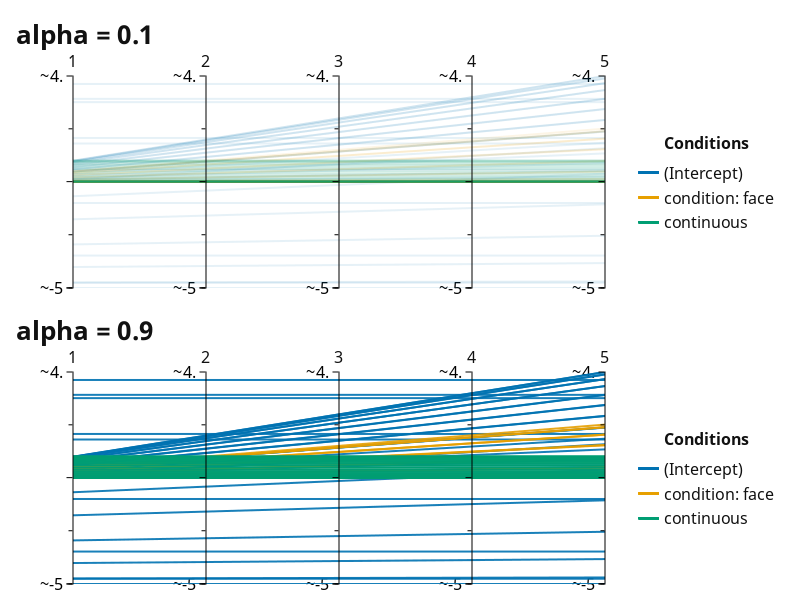
Configurations of Parallel coordinates plot
UnfoldMakie.plot_parallelcoordinates — Functionplot_parallelcoordinates(f::Union{GridPosition, GridLayout, Figure}, data::DataFrame; kwargs)Plot a PCP (parallel coordinates plot).
Arguments:
f::Union{GridPosition, GridLayout, Figure}: Figure or GridPosition in which the plot should be drawn.data::DataFrame: data for the plot visualization.
key word argumets (kwargs)
normalize(default:nothing): if:minmax, normalize each axis to their respective min-max range.ax_labels(Array, default:nothing): specify axis names. Should be a vector of labels with length equal to the number of uniquemapping.xvalues. Example:ax_labels= ["Fz", "Cz", "O1", "O2"].ax_ticklabels(default:outmost): specify tick labels on axis.:all- show all labels on all axes.:left- show all labels on the left axis, but only min and max on others.:outmost- show labels on min and max of all other axes.:none- remove all labels.
bend(defaultfalse): change straight lines between the axes to curved ("bent") lines using spline interpolation. Note: While this makes the plot look cool, it is not generally recommended to bent the lines, as interpretation suffers, and the resulting visualizations can be potentially missleading.
Defining the axes
- Default:
...(...; mapping=(; x=:channel, y=:estimate)). One could overwrite what should be on the x and the y axes. - By setting
...(...; mapping=(; color=:colorcolumn))one defines conditions splitted by color. The default color is defined by...(...; visual=(; color=:black)).
Change transparency
use ...(...; visual=(; alpha=0.5)) to change transparency.
Shared plot configuration options
The shared plot options can be used as follows: type = (; key=value, ...)) - for example plot_x(...; layout = (; show_legend=true, legend_position=:right)). Multiple defaults will be cycled until match.
figure = NamedTuple() - use kwargs... of Makie.Figure
axis = (ylabel = "Time",) - use kwargs... of Makie.Axis
layout = (show_legend = true, legend_position = :right, xlabelFromMapping = :x, ylabelFromMapping = :y, use_colorbar = false)
mapping = (x = :channel, y = (:estimate, :yhat, :y))
visual = (colormap = ColorTypes.RGBA{Float32}[RGBA{Float32}(0.0f0,0.44705883f0,0.69803923f0,1.0f0), RGBA{Float32}(0.9019608f0,0.62352943f0,0.0f0,1.0f0), RGBA{Float32}(0.0f0,0.61960787f0,0.4509804f0,1.0f0), RGBA{Float32}(0.8f0,0.4745098f0,0.654902f0,1.0f0), RGBA{Float32}(0.3372549f0,0.7058824f0,0.9137255f0,1.0f0), RGBA{Float32}(0.8352941f0,0.36862746f0,0.0f0,1.0f0), RGBA{Float32}(0.9411765f0,0.89411765f0,0.25882354f0,1.0f0)], color = :black, alpha = 0.3) - use kwargs... of $Makie.lines$
legend = (orientation = :vertical, tellwidth = true, tellheight = false, title = "Conditions", merge = true, framevisible = false) - use kwargs... of Makie.Legend
colorbar = (vertical = true, tellwidth = true, tellheight = false) - use kwargs... of Makie.Colorbar
Return Value:
The input f
This page was generated using Literate.jl.