Butterfly Plot Visualization
Here we discuss butterfly plot visualization. Make sure you have looked into the installation instructions.
Since the configurations for ERP plots can be applied to butterfly plots as well. Here you can find the configurations for ERP plots.
Package loading
The following modules are necessary for run this tutorial:
using UnfoldMakie
using Unfold
using CairoMakie
using DataFrames
Note that DataFramesMeta is also used here in order to be able to use @subset for testing (filtering).
Data
We filter the data to make it more clearly represented:
include("../../../example_data.jl")
df, pos = example_data("TopoPlots.jl")
first(df, 3)| Row | estimate | time | channel | coefname | topo_positions | se | pval |
|---|---|---|---|---|---|---|---|
| Float64 | Float64 | Int64 | String | Any | Float64 | Float64 | |
| 1 | 0.020321 | -0.3 | 1 | A | (0.493714, 0.544031) | 0.122875 | 0.266091 |
| 2 | 0.017548 | -0.298 | 1 | A | (0.493714, 0.544031) | 0.124345 | 0.29664 |
| 3 | 0.0150747 | -0.296 | 1 | A | (0.493714, 0.544031) | 0.124828 | 0.323592 |
Plot Butterfly Plots
The default butterfly plot:
plot_butterfly(df)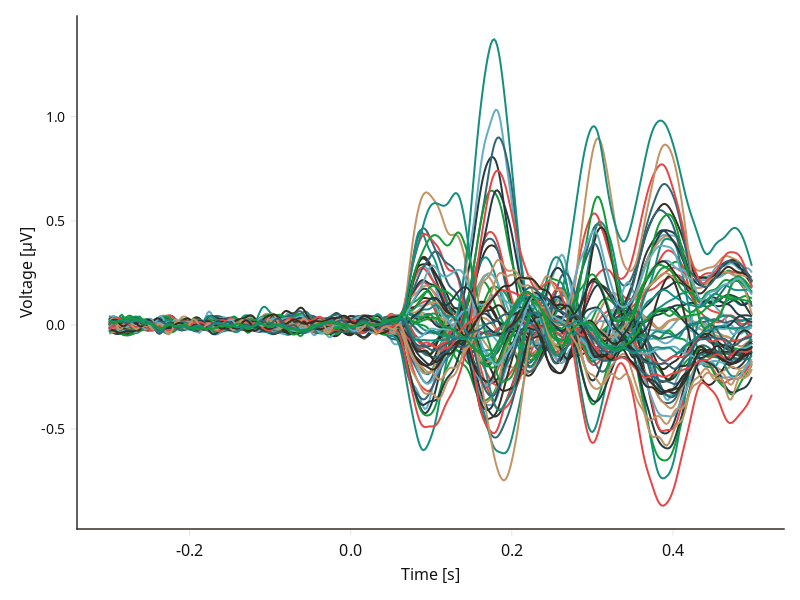
The butterfly plot with corresponding topoplot. You need to provide the channel positions.
plot_butterfly(df; positions = pos)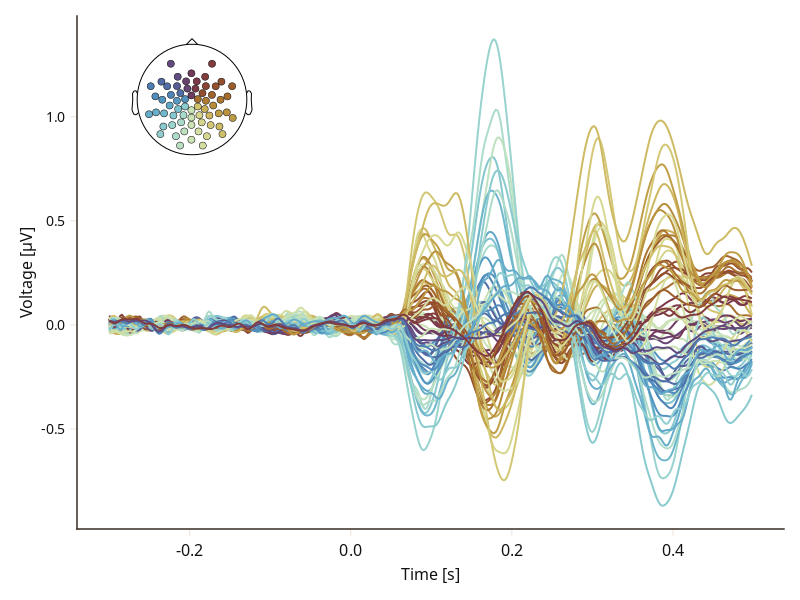
You want to change size of topomarkers and size of topoplot:
plot_butterfly(df; positions = pos, topomarkersize = 10, topoheigth = 0.4, topowidth = 0.4)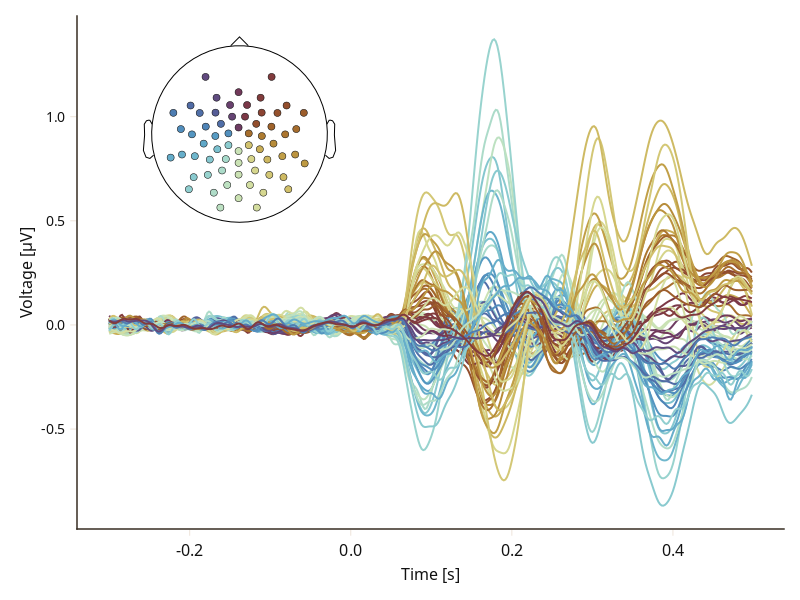
You want to add vline and hline:
f = Figure()
plot_butterfly!(f, df; positions = pos)
hlines!(0, color = :gray, linewidth = 1)
vlines!(0, color = :gray, linewidth = 1)
f
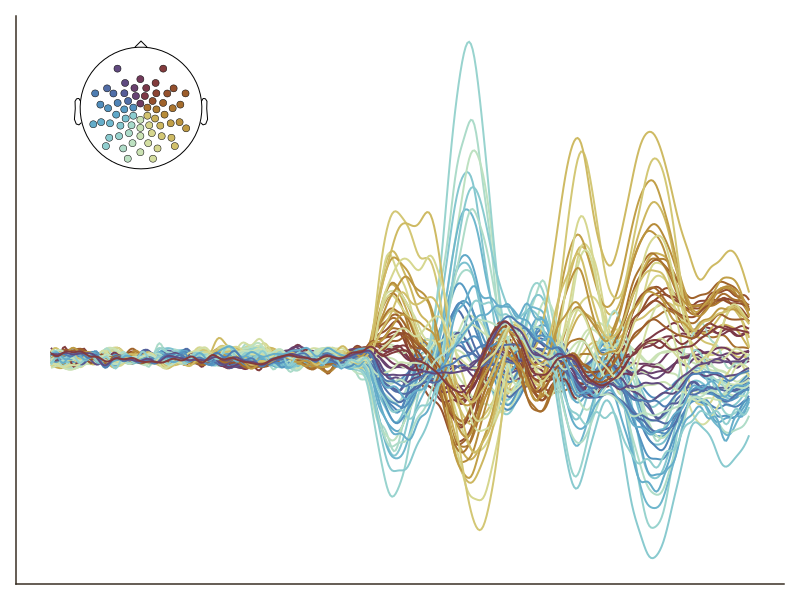
You want to remove all decorations:
plot_butterfly(
    df;
    positions = pos,
    layout = (; hidedecorations = (:label => true, :ticks => true, :ticklabels => true)),
)
Column Mappings for Butterfly Plot
Since butterfly plots use a DataFrame as input, the library needs to know the names of the columns used for plotting. You can set these mapping values by calling plot_butterfly(...; mapping=(; :x=:time)). Just specify a NamedTuple (note the ; right after the opening parentheses).
Configurations of Butterfly Plot
UnfoldMakie.plot_butterfly — FunctionPlot a butterfly plot plotbutterfly(plotdata::DataFrame; positions=nothing)
kwargs (...; ...):
positions(Array,[]): if specified, adds a topoplot as an inset legend to the provided channel positions. Must be the same length asplot_data. To change the colors of the channel lines use thetopoposition_to_colorfunction.topolegend(bool, default=true): show an inlay topoplot with corresponding electrodes. Requirespositionsto be provided.topomarkersize(Real, default=10): change the size of the markers, topoplot-inlay electrodes.topowidth(Real, default=0.25): change the size of the inlay topoplot width.topoheigth(Real, default=0.25): change the size of the inlay topoplot height.topopositions_to_color(function, ´x -> posToColorRomaO(x)´): change the colors of the channel lines.
Shared plot configuration options
The shared plot options can be used as follows: type = (; key=value, ...)) - for example plot_x(...; layout = (; show_legend=true, legend_position=:right)). Multiple defaults will be cycled until match.
figure = NamedTuple() - use kwargs... of Makie.Figure
axis = (xlabel = "Time [s]", ylabel = "Voltage [µV]", yticklabelsize = 14) - use kwargs... of Makie.Axis
layout = (show_legend = false, legend_position = :right, xlabelFromMapping = :x, ylabelFromMapping = :y, use_colorbar = false, hidespines = (:r, :t), hidedecorations = Dict{Symbol, Bool}(:label => 0, :ticks => 0, :ticklabels => 0))
mapping = (x = (:time,), y = (:estimate, :yhat, :y), color = (:channel, :channels, :trial, :trials), positions = (:pos, :positions, :position, :topo_positions, :x, nothing), labels = (:labels, :label, :topoLabels, :sensor, nothing))
visual = (colormap = :roma,) - use kwargs... of $Makie.lines$
legend = (orientation = :vertical, tellwidth = true, tellheight = false, framevisible = false) - use kwargs... of Makie.Legend
colorbar = (vertical = true, tellwidth = true, tellheight = false) - use kwargs... of AlgebraOfGraphics.colobar!
see also plot_erp
This page was generated using Literate.jl.