Change colormap of Butterfly plot
You want to change the colors of the lines and markers on the inserted topoplot. To do that you need to change the color scheme (aka color map) of the butterfly plot. You can find the list of colormaps for Makie here.
Setup
using UnfoldMakie
using CairoMakie
using DataFramesMeta
using Colors

results, positions = UnfoldMakie.example_data("TopoPlots.jl");
Simpliest way to change the colors is to use visual.colormap argument.
plot_butterfly(results; positions = positions, visual = (; colormap = :viridis))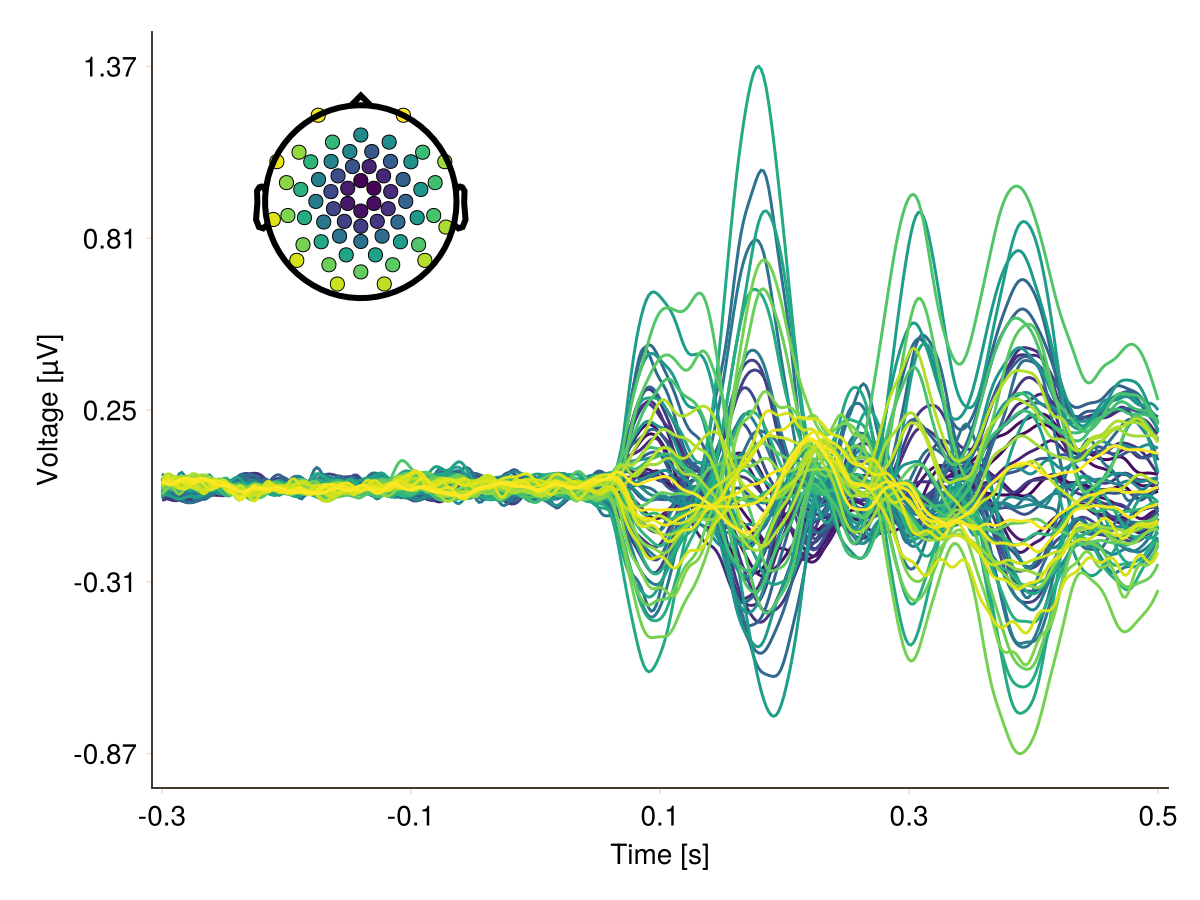
But as you may notice it is not the correct way to do it: color is changing from center to periphery, but not according to the position of the electrodes.
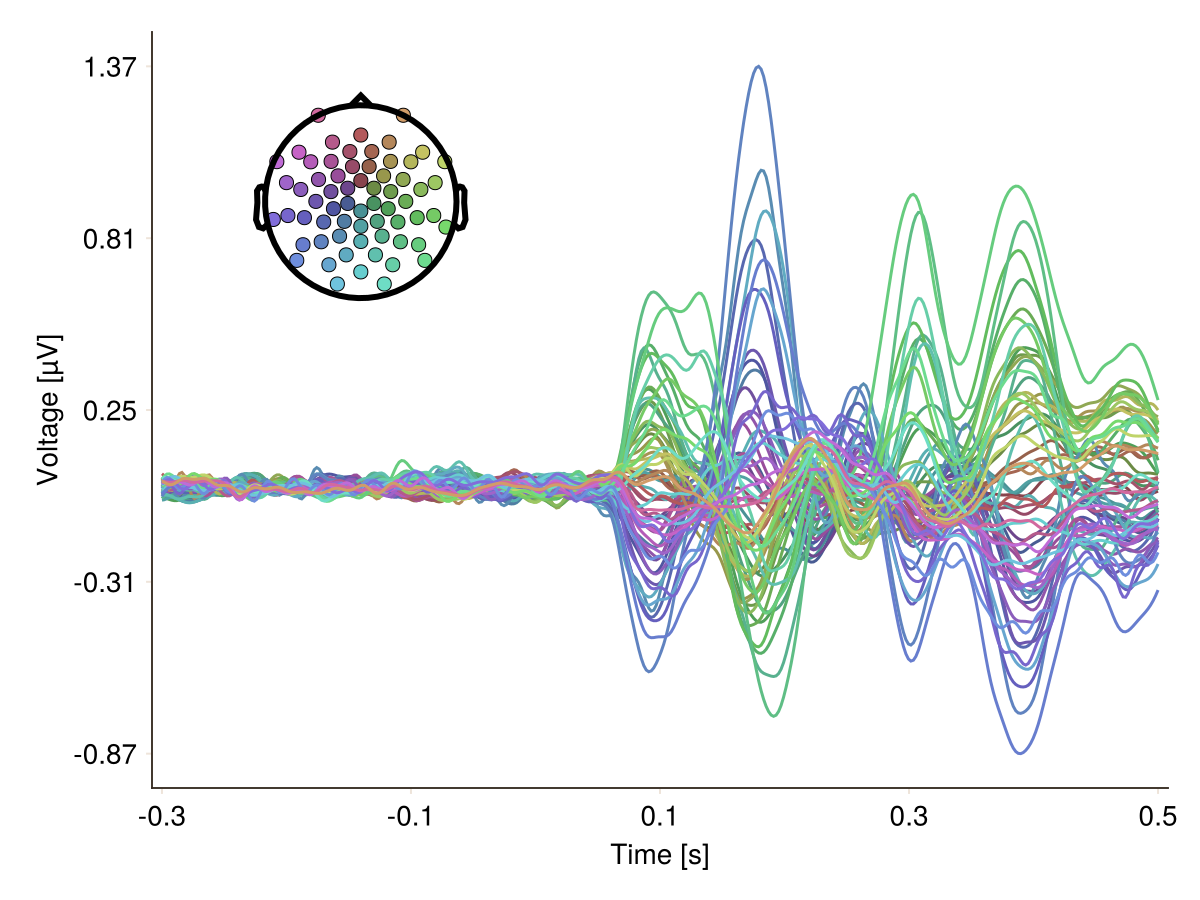
By default we use romaO colormap using the methods described below:
plot_butterfly(results; positions = positions)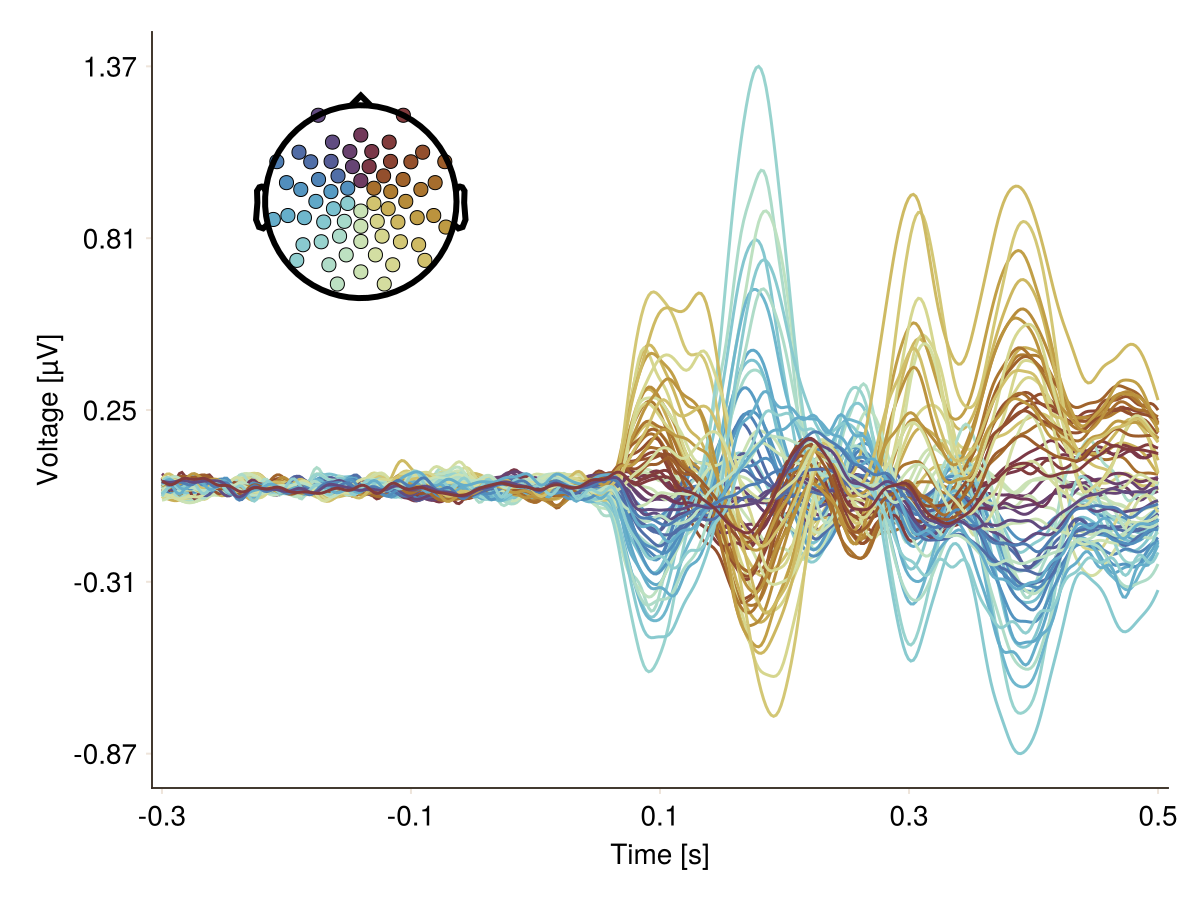
Color schemes
MNE style
We can change the color scale by specifying a function that maps from an (x, y) tuple to a color. UnfoldMakie currently provides three different color scales:
pos_to_color_RGB(same as MNE-Python),pos_to_color_HSV(HSV color space),pos_to_color_RomaO.
While RGB & HSV have the advantage of being 2D color maps, Roma0 has the advantage of being perceptually uniform. Also you can specify a uniform color.
plot_butterfly(
    results;
    positions = positions,
    topopositions_to_color = pos -> UnfoldMakie.pos_to_color_RGB(pos),
)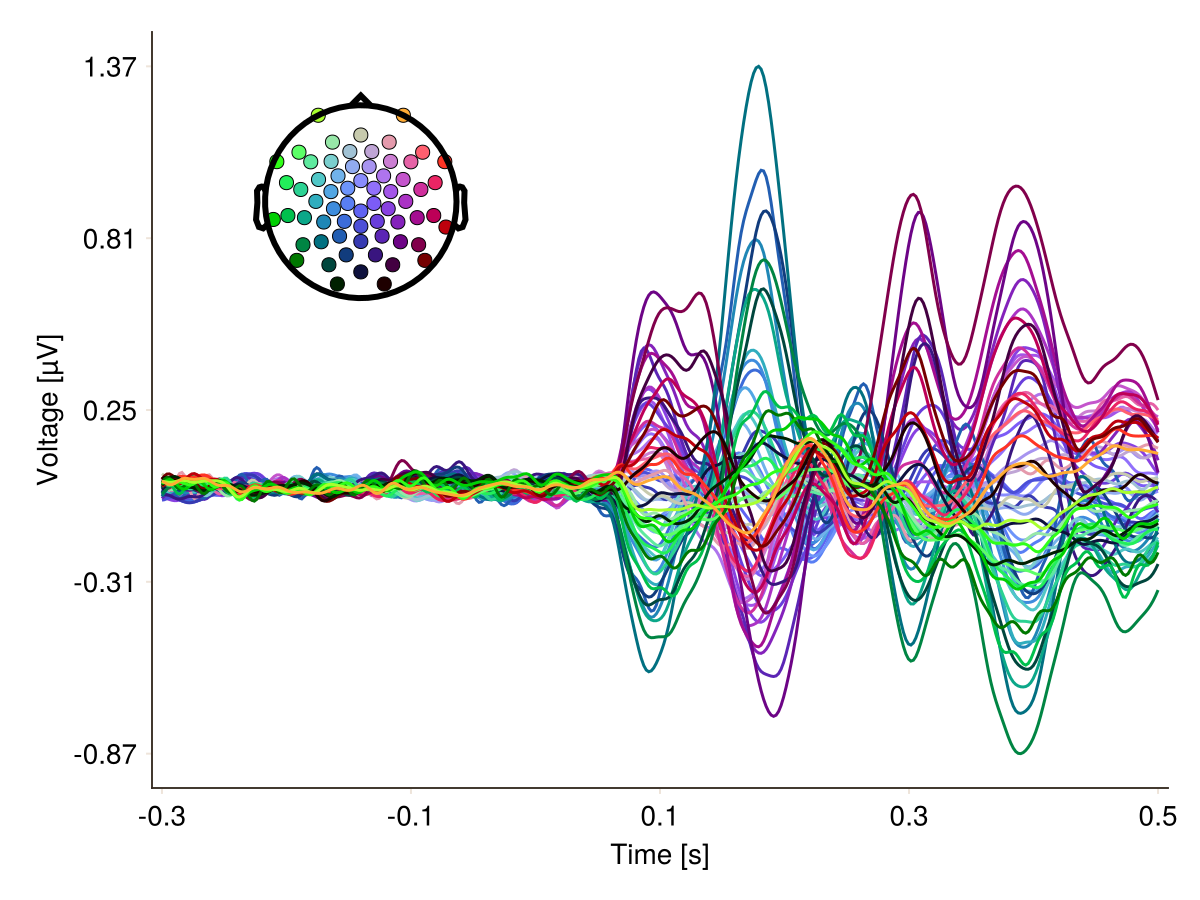
HSV-Space
plot_butterfly(
    results;
    positions = positions,
    topopositions_to_color = UnfoldMakie.pos_to_color_HSV,
)
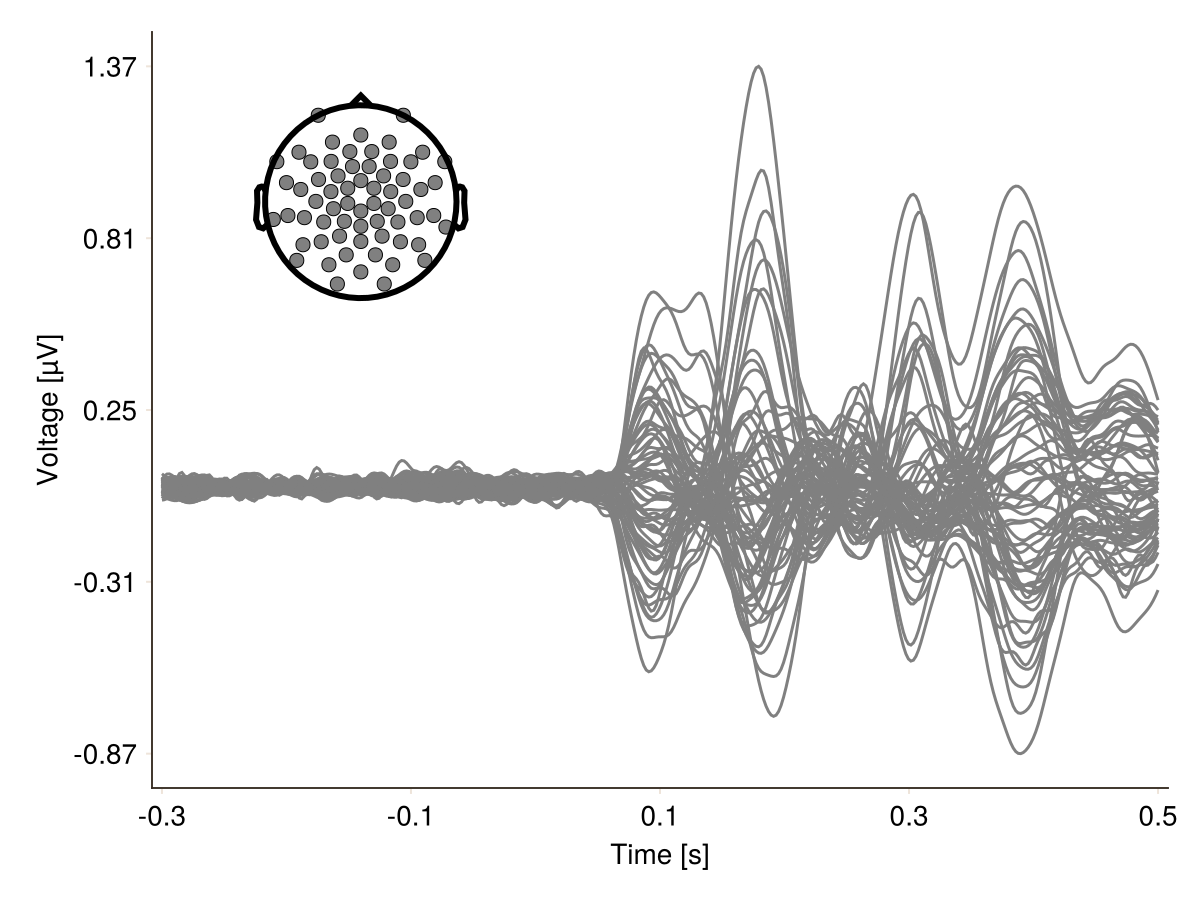
Uniform Color
You can make all lines "gray", or any other arbitrary color. Also you can make it a function of electrode position.
plot_butterfly(
    results;
    positions = positions,
    topopositions_to_color = x -> Colors.RGB(0.5),
)
Transparency
Unlike RGB, RGBA has a fourth channel, alpha, which is responsible for transparency. Here are two examples of how to manipulate it.
f = Figure()
plot_butterfly!(
    f[1, 1],
    results;
    positions = positions,
    topopositions_to_color = x -> (RGBA(UnfoldMakie.pos_to_color_RomaO(x), 1)),
)

plot_butterfly!(
    f[2, 1],
    results;
    positions = positions,
    topopositions_to_color = x -> (GrayA(UnfoldMakie.pos_to_color_RomaO(x), 0.5)),
)
f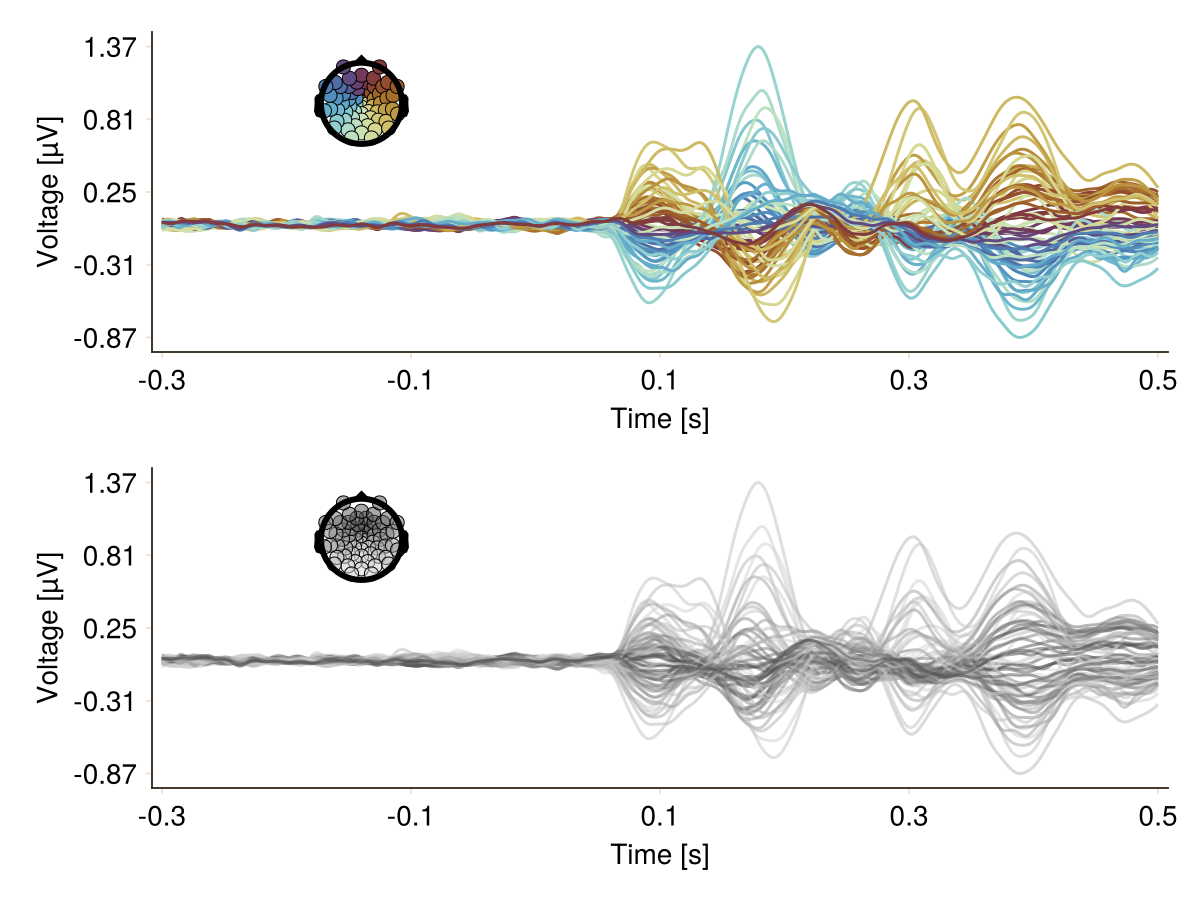
This page was generated using Literate.jl.