Circular Topoplots
Circular topoplot series is a plot type for visualizing EEG activity in relation to some continous variable arranged on a circluar line. It can fully represent channel and channel location dimensions using contour lines. It can also partially represent the varaible dimension. Variable could be for instance saccadic amplitude or degrees of visual angle. Basically, it is a series of Topoplots arranged on a circle.
Setup
Package loading
using UnfoldMakie
using CairoMakie
using TopoPlots # for example data
using Random
using DataFrames
Data generation Generate a Dataframe. We need to specify the Topoplot positions either via position, or via labels.
data, pos = TopoPlots.example_data();
dat = data[:, 240, 1]
df = DataFrame(
    :estimate => eachcol(Float64.(data[:, 100:40:300, 1])),
    :circular_variable => [0, 50, 80, 120, 180, 210],
    :time => 100:40:300,
)
df = flatten(df, :estimate);
Plot generations
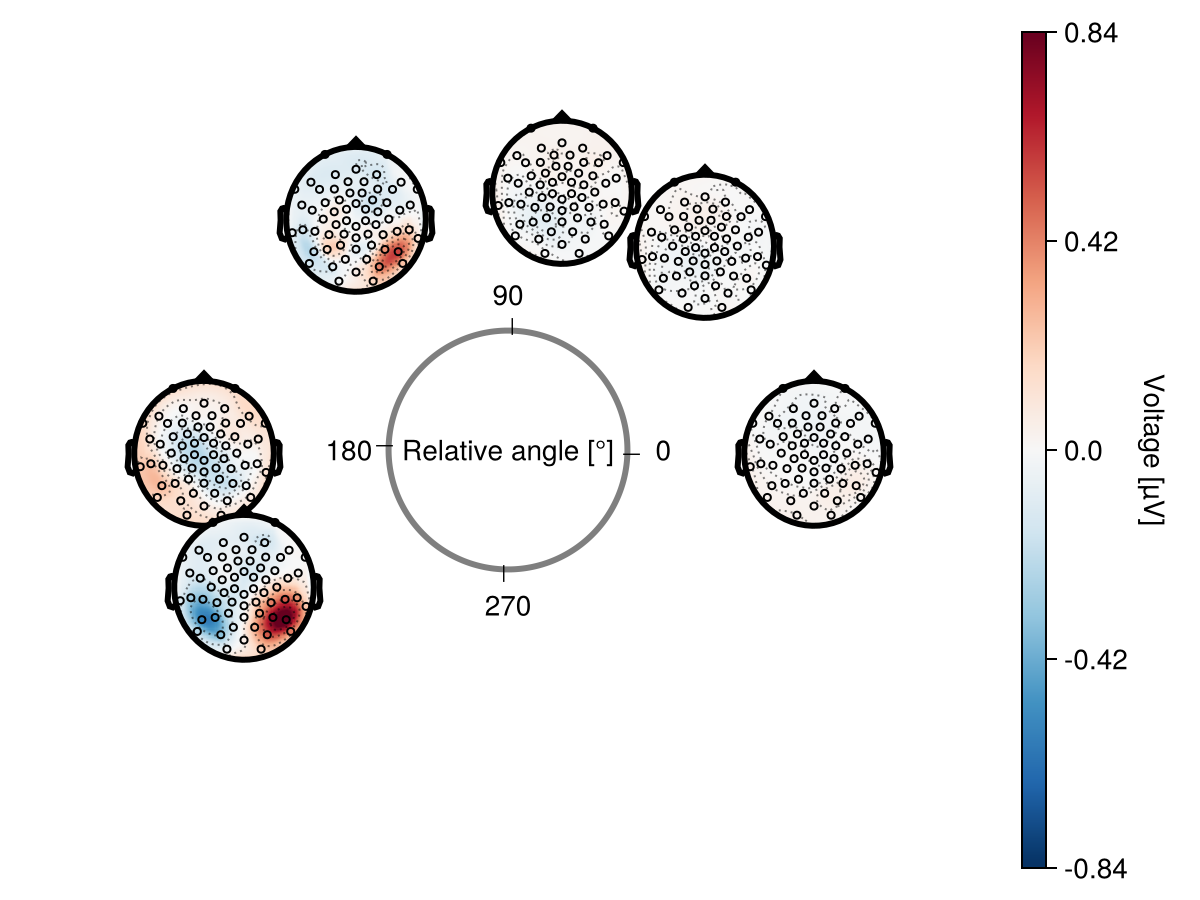
Note how the plots are located at the angles of the circular_variable.
plot_circular_topoplots(
    df;
    positions = pos,
    center_label = "Relative angle [°]",
    predictor = :circular_variable,
)
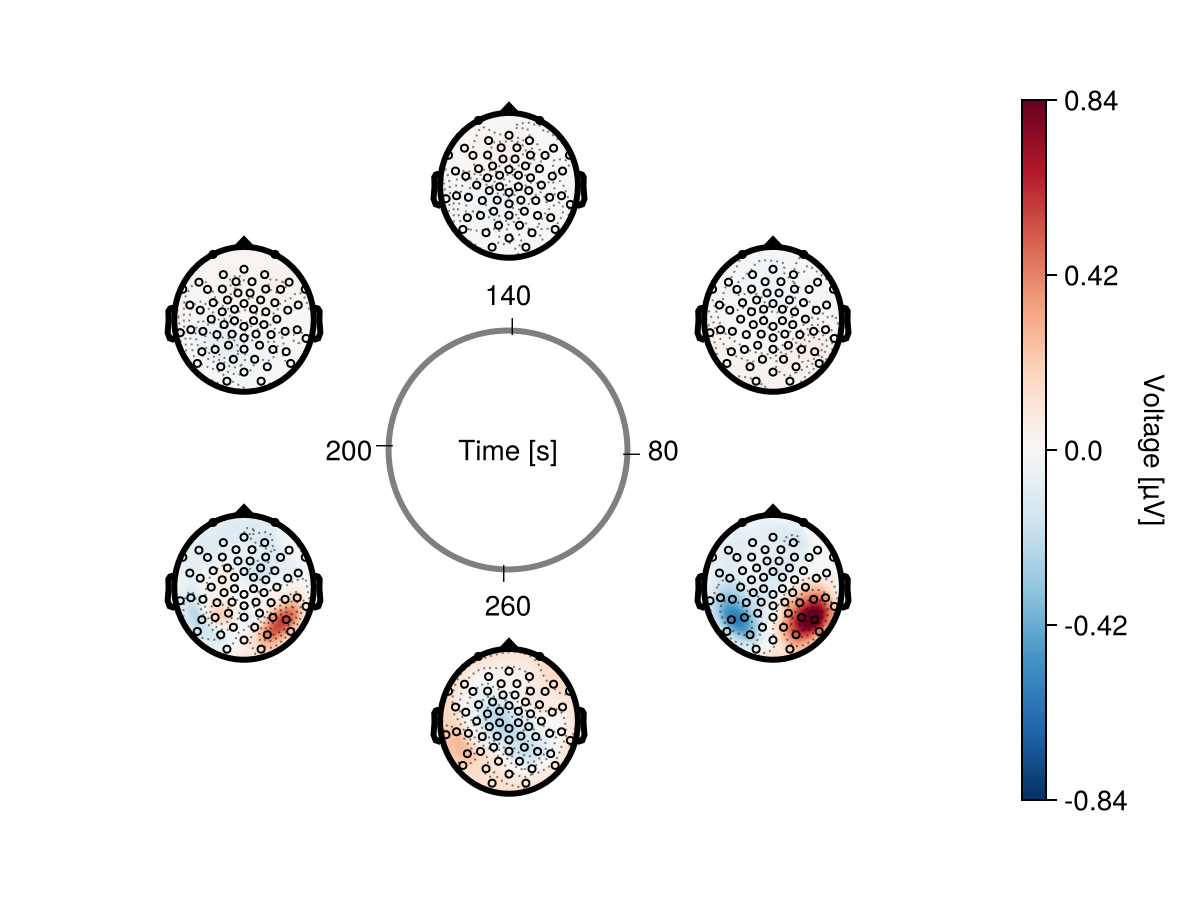
If the bounding variable is not between 0 and 360, since we are using time, we must specify it.
plot_circular_topoplots(
    df;
    positions = pos,
    center_label = "Time [s]",
    predictor = :time,
    predictor_bounds = [80, 320],
    colorbar = (; height = 350),
)
Configurations of Circular Topoplots
UnfoldMakie.plot_circular_topoplots — Function
plot_circular_topoplots!(f, data::DataFrame; kwargs...)using ColorSchemes: topo using ColorSchemes: topo using ColorSchemes: topo plotcirculartopoplots(data::DataFrame; kwargs...)
Plot a circular EEG topoplot.
Arguments
f::Union{GridPosition, GridLayout, Figure}
Figure,GridLayout, orGridPositionto draw the plot.data::DataFrame
DataFrame with data keys (columns:y, :yhat, :estimate), and :position (columns:pos, :position, :positions).
Keyword arguments (kwargs)
predictor::Vector{Any} = :predictor
The circular predictor value, defines position of topoplot across the circle. Mapped aroundpredictor_bounds.predictor_bounds::Vector{Int64} = [0, 360]
The bounds of the predictor. Relevant for the axis labels.positions::Vector{Point{2, Float32}} = nothing
Positions of theplot_topoplot.center_label::String = ""
The text in the center of the cricle.plot_radius::String = 0.8
The radius of the circular topoplot series plot calucalted by formula:radius = (minwidth * plot_radius) / 2.labels::Vector{String} = nothing
Labels for theplot_topoplots.topo_axis::NamedTuple = (;)
Here you can flexibly change configurations of the topoplot axis.
To see all options just type?Axisin REPL.
Defaults: (width = Relative(0.2f0), height = Relative(0.2f0), aspect = 1)topo_attributes::NamedTuple = (;)
Here you can flexibly change configurations of the topoplot interoplation.
To see all options just type?Topoplot.topoplotin REPL.
Defaults: interp_resolution = (128, 128), interpolation = CloughTocher()colorbar.position = :right
Possible options::right,:left. Sets position of the colorbar.
Shared plot configuration options
The shared plot options can be used as follows: type = (; key = value, ...)).
For example, plot_x(...; colorbar = (; vertical = true, label = "Test")).
Multiple defaults will be cycled until match.
Placing ; is important!
figure = NamedTuple() - use kwargs... of Makie.Figure
axis = (xlabel = "Time", aspect = 1) - use kwargs... of Makie.Axis
layout = (show_legend = false, use_colorbar = true, hidespines = (), hidedecorations = Dict{Symbol, Bool}(:label => 0)) - check this page
mapping = (x = nothing, y = (:estimate, :yhat, :y), positions = (:pos, :positions, :position, nothing), labels = (:labels, :label, :sensor, nothing)) - use any mapping from AlgebraOfGraphics
visual = (colormap = Makie.Reverse{Symbol}(:RdBu), contours = (color = :white, linewidth = 2), enlarge = 1, label_scatter = true, label_text = false, bounding_geometry = GeometryBasics.Circle) - use kwargs... of Topoplot.eeg_topoplot
legend = (orientation = :vertical, tellwidth = true, tellheight = false, halign = :right, valign = :center) - use kwargs... of Makie.Legend
colorbar = (vertical = true, tellwidth = true, tellheight = false, labelrotation = -1.5707963267948966, flipaxis = true, label = "Voltage [µV]", position = :right, colormap = Makie.Reverse{Symbol}(:RdBu)) - use kwargs... of Makie.Colorbar
Return Value: Figure displaying the Circular topoplot series.
This page was generated using Literate.jl.