Hiding decorations and spines
You have several options for efficiently hiding decorations and axis spines in a plot. Packages and data
using TopoPlots
using UnfoldMakie
using CairoMakie
using DataFrames
using UnfoldSim

data, pos = UnfoldMakie.example_data("TopoPlots.jl")
dat, evts = UnfoldSim.predef_eeg(; noiselevel = 10, return_epoched = true);
Hiding
First, you can specify the axis settings with axis = (; ...).
Makie.Axis provides multiple variables for different aspects of the plot. This means that removing all decorations is only possible by setting many variables each time.
Second, Makie does provide methods like hidespines! and hidedecorations!. Unforunately, user may lose access to a plot after it is drawn in.
Third, hidespines! and hidedecorations! can be called by setting variables with layout = (; hidespines = (), hidedecorations = ()).
You still will able to specify it flexibly: hidespines = (:r, :t) will remove the top and right borders.
f = Figure()
plot_butterfly!(
    f[1, 1],
    data;
    positions = pos,
    topo_axis = (; height = Relative(0.4), width = Relative(0.4)),
    axis = (; title = "With decorations"),
)
plot_butterfly!(
    f[2, 1],
    data;
    positions = pos,
    topo_axis = (; height = Relative(0.4), width = Relative(0.4)),
    axis = (; title = "Without decorations"),
    layout = (; hidedecorations = (:label => true, :ticks => true, :ticklabels => true)),
)
f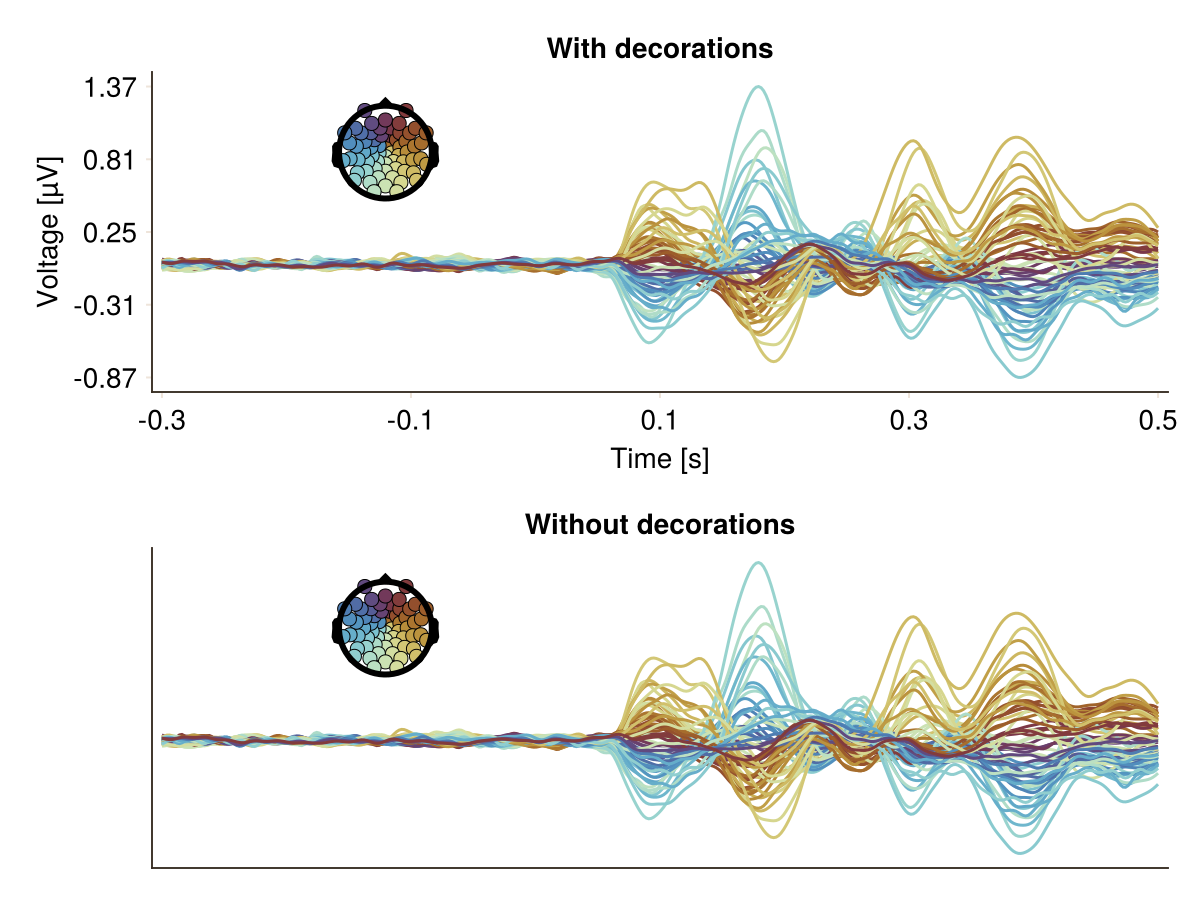
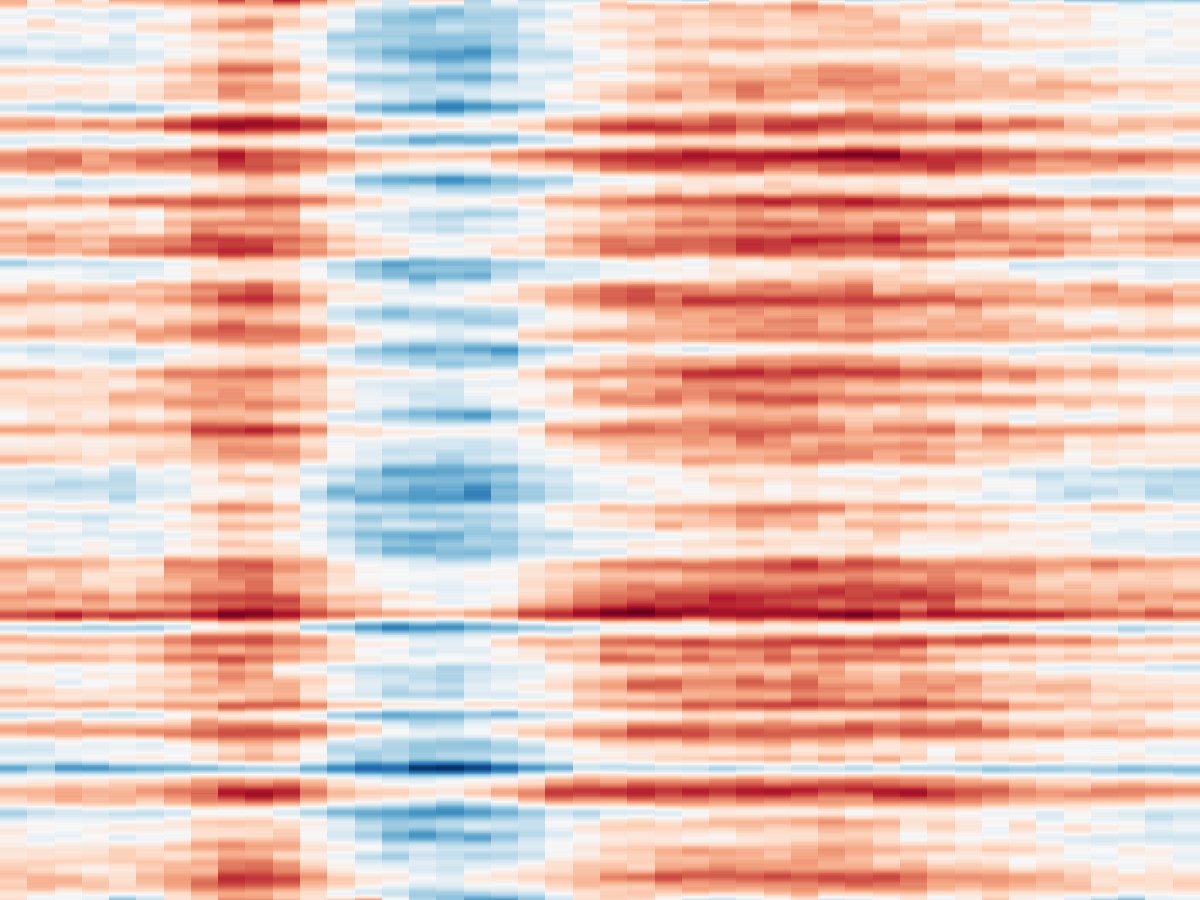
You can also completely remove all spines, decorations, color bars, and even padding.
f = Figure(; figure_padding = 0)
plot_erpimage!(
    f,
    dat;
    layout = (; hidespines = (), hidedecorations = (), use_colorbar = false),
)
Showing
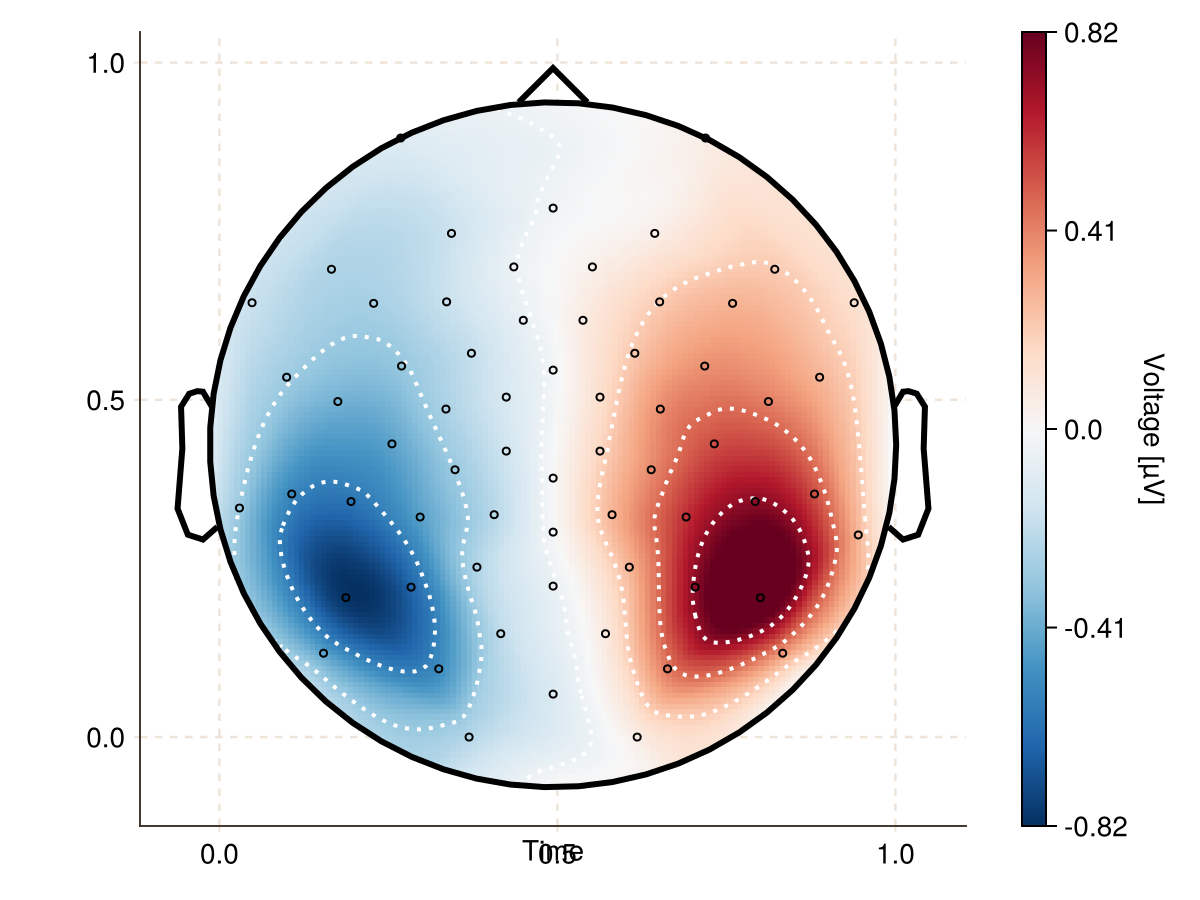
Some plots hide features by default. This could be reverted by setting the variables to nothing
data, positions = TopoPlots.example_data()
plot_topoplot(
    data[:, 340, 1];
    positions = positions,
    layout = (; hidespines = nothing, hidedecorations = nothing),
)
For more information on the input of these functions refer to the Makie dokumentation on Axis.
This page was generated using Literate.jl.