Topoplot
Topoplot (aka topography plot) is a plot type for visualisation of EEG activity in a specific time stemp or time interval. It can fully represent channel and channel location dimensions using contour lines.
The topoplot is a 2D projection and interpolation of the 3D distributed sensor activity. The name stems from physical geography, but instead of height, the contour lines represent voltage levels.
Setup
Package loading
using UnfoldMakie
using DataFrames
using CairoMakie, MakieThemes
using TopoPlots
Data loading
topo_array, topo_positions = TopoPlots.example_data();
tp = 100; # time point
The size of topo_array is 64×400×3. This means:
- 64 channels;
- 400 timepoints in range from -0.3 to 0.5 mseconds;
- Estimates of 3 averaging functions. Instead of displaying the EEG data for all subjects, here we aggregate the data using (1) mean, (2) standard deviation and (3) p-value within t-tests.
While position consist of 64 x and y coordinates of each channels on a scalp.
Plot a topoplot
Let's select the mean estimate at time point tp.
plot_topoplot(
    topo_array[:, tp, 1];
    positions = topo_positions,
    axis = (; xlabel = "Time point $tp"),
    colorbar = (; height = 350),
)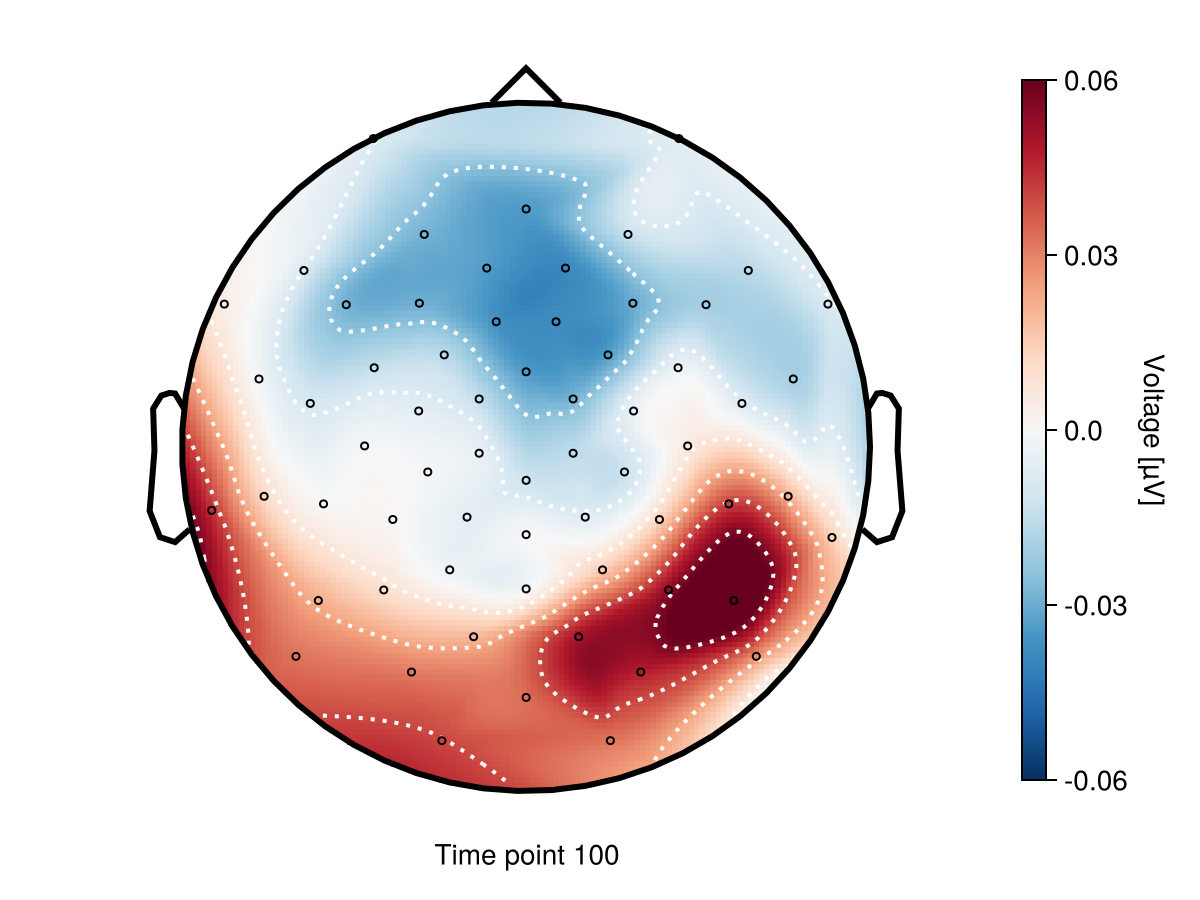
A typical topoplot consists of:
- a head outline showing the voltage at a given time point or over a time window;
- a colorbar for the voltage scale;
- channel markers and labels (sensors/electrodes).
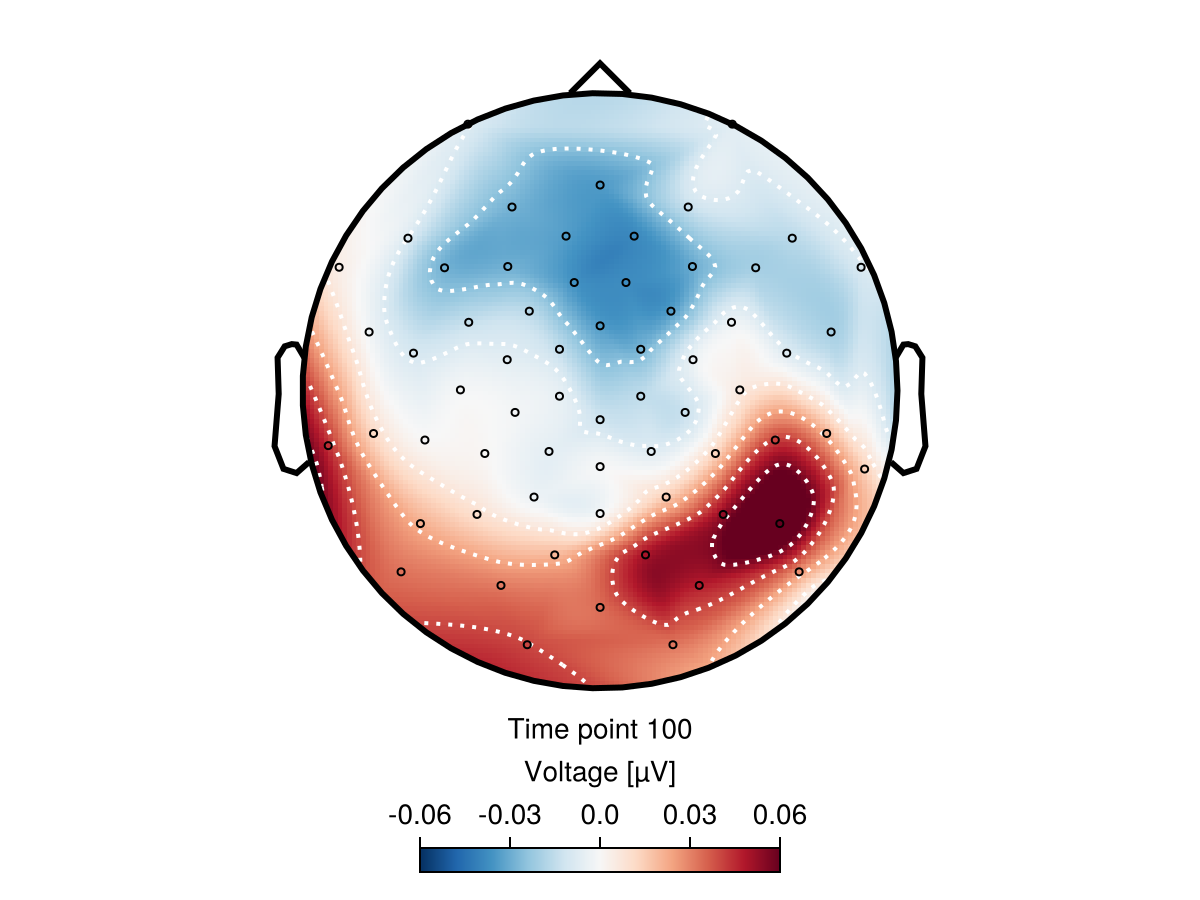
Horizontal colorbars
Topoplot colorbars can be vertical or horizontal. Horizontal colorbars are useful when displaying multiple plots side by side. Set colorbar.vertical = false to switch to a horizontal orientation.
plot_topoplot(
    topo_array[:, tp, 1];
    positions = topo_positions,
    axis = (; xlabel = "Time point $tp"),
    colorbar = (; vertical = false, position = :bottom, width = 180),
)
Colormaps
When choosing a colormap for topoplots, it should:
- Be “scientific”: perceptually linear, with a meaningful and ordered color scale;
- Be diverging (to distinguish positive vs. negative effects);
- Be color-blind friendly.
begin
    f = Figure(size = (700, 700))
    Label(
        f[0, 1:3],
        "Topoplots with Diverging Scientific Colormaps";
        fontsize = 22,
        halign = :center,
    )

    colormaps = [:berlin, :roma, :lisbon, :cork, :managua, :bam]

    for (i, cmap) in enumerate(colormaps)
        r = div(i - 1, 3) + 1   # row index (1 or 2)
        c = mod(i - 1, 3) + 1   # column index (1 → 3)

        plot_topoplot!(f[r, c],
            topo_array[:, tp, 1];
            positions = topo_positions,
            axis = (; xlabel = "Time point $tp", title = string(cmap)),
            colorbar = (; vertical = false, position = :bottom, width = 180),
            visual = (; colormap = cmap, contours = false),
        )
    end
    f
end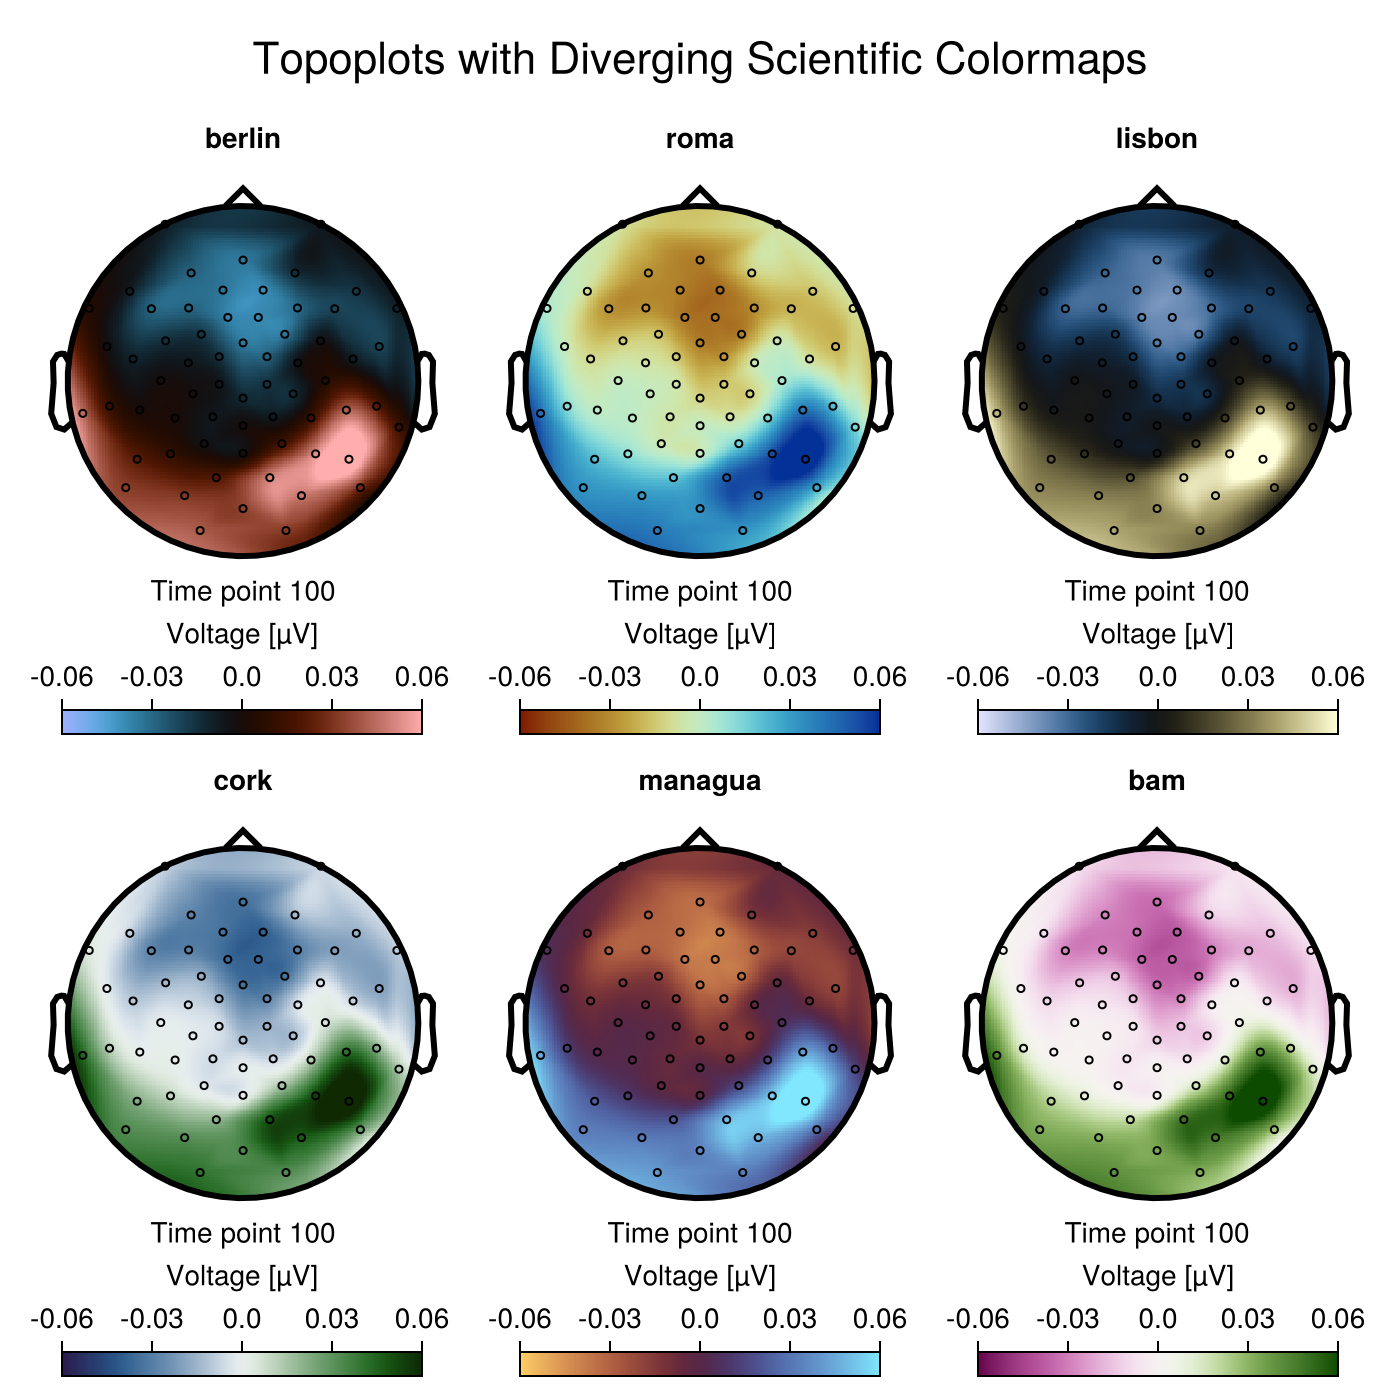
Channel labels
Changing fonts and font size Here we use arbitrary labels "s1", "s2", ..., "s64" for demonstration. To learn how to use real channel names, check the dedicated page about channel labels.
labels = ["s$i" for i = 1:size(topo_array, 1)]

with_theme(Theme(; fontsize = 25, fonts = (; regular = "Ubuntu Mono"))) do
    plot_topoplot(
        topo_array[:, tp, 1];
        labels,
        positions = topo_positions,
        visual = (; label_text = true),
        axis = (; xlabel = "Time point $tp"),
    )
end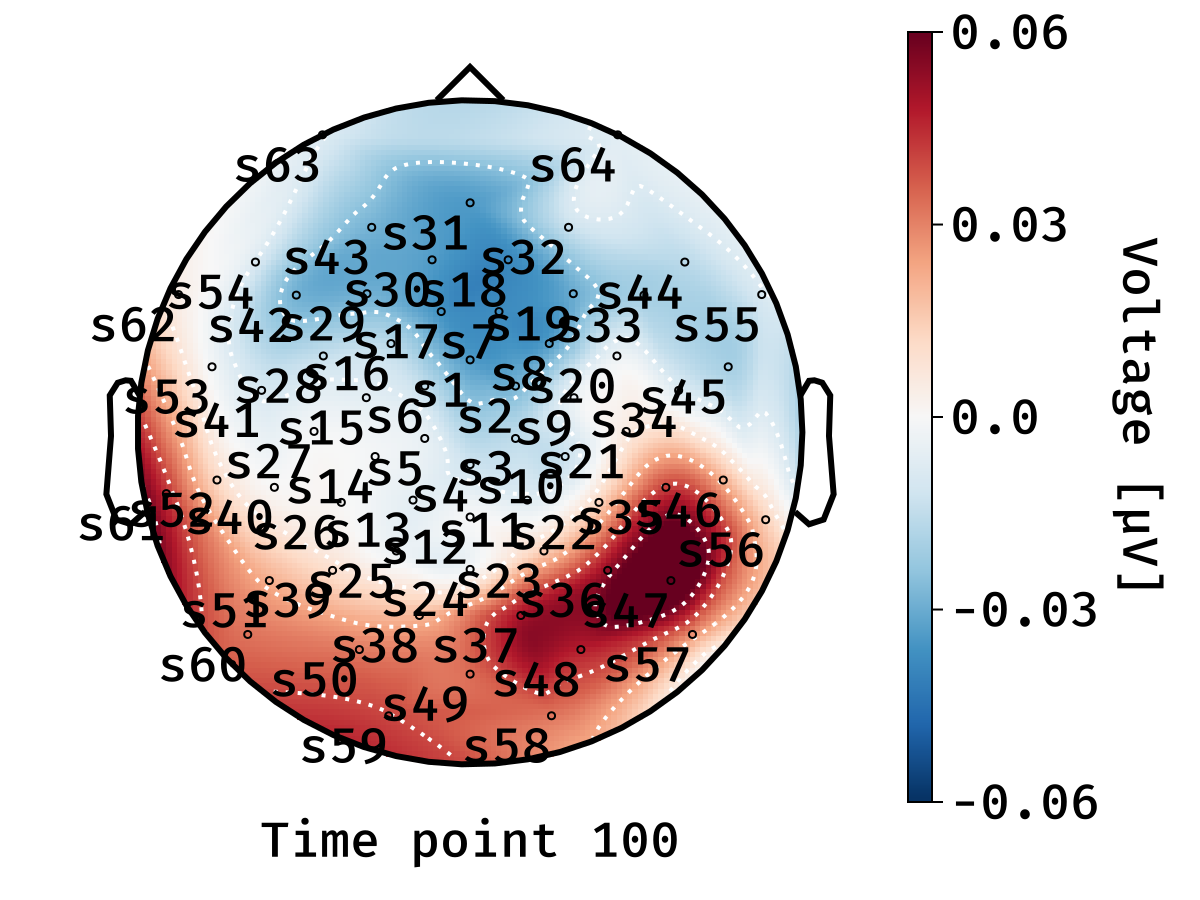
Check that the font you choose is available on your PC or GitHub.
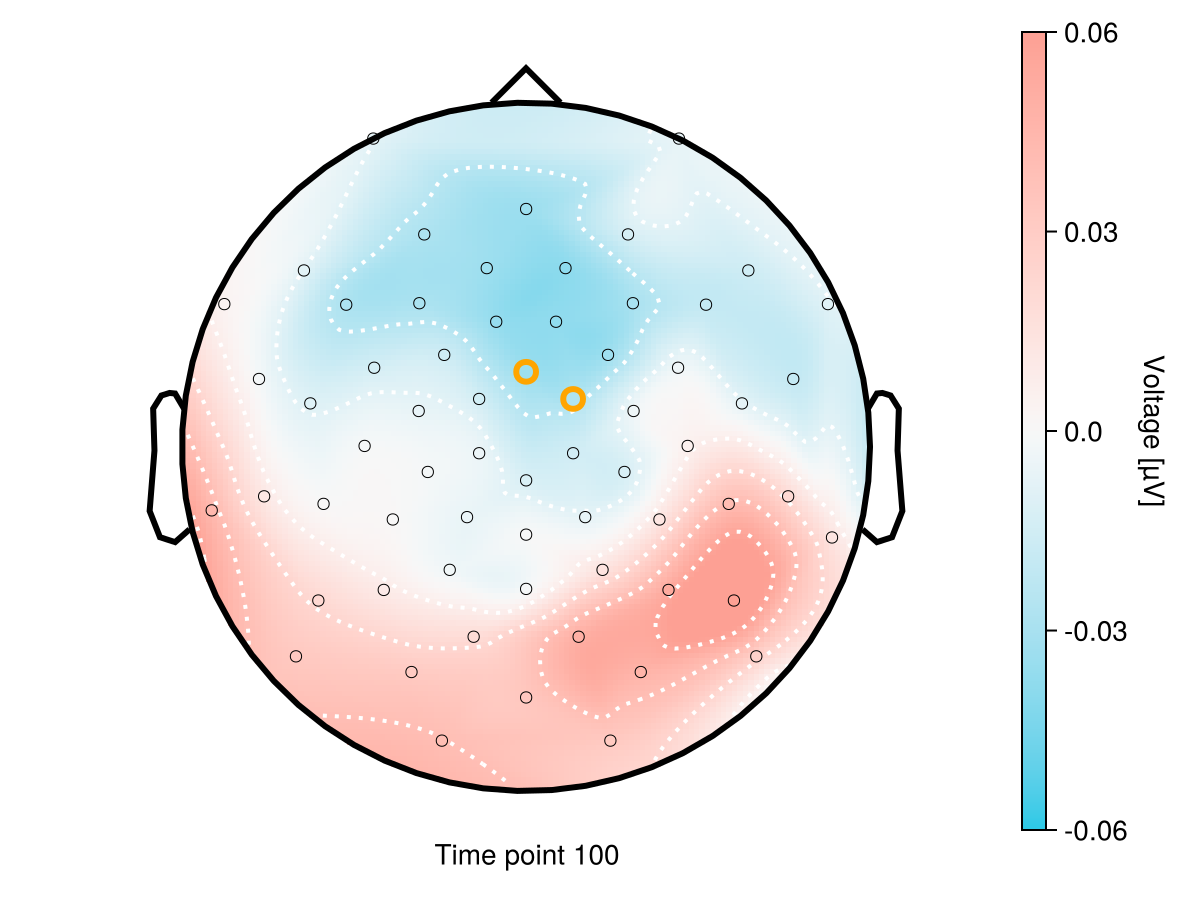
Highlighting channels
Create per-channel styles
colors = fill(:black, 64)      # default
sizes = fill(8, 64)           # default size
strokes = fill(0.5, 64);        # default width
Highlight first two
colors[1:2] .= (:orange, :orange)
sizes[1:2] .= (14, 14)
strokes[1:2] .= (3, 3)

plot_topoplot(
    topo_array[:, tp, 1];
    positions = topo_positions,
    axis = (; xlabel = "Time point $tp"),
    visual = (; colormap = :diverging_tritanopic_cwr_75_98_c20_n256),
    topo_attributes = (;
        label_scatter = (;
            markersize = sizes,
            color = colors,
            strokewidth = strokes,
            strokecolor = colors,
        )
    ),
)
Advanced markers
You can use markers and their proeprties as additional information dimension. For instance, to map uncertaitny or some other value to the marker size, color or rotation. This is done by setting the topo_attributes kwarg. The following example shows how to set the marker size and color based on the data values. Check more here.
Markers as arrows
begin
    f = Figure()
    uncert_norm =
        (topo_array[:, tp, 2] .- minimum(topo_array[:, tp, 2])) ./
        (maximum(topo_array[:, tp, 2]) - minimum(topo_array[:, tp, 2]))
    rotations = -uncert_norm .* π # radians in [-2π, 0], negaitve - clockwise rotation

    arrow_symbols = ['↑', '↗', '→', '↘', '↓'] # 5 levels of uncertainty

    angles = range(extrema(topo_array[:, tp, 2])...; length = 5)
    labels = ["$(round(a, digits = 2))" for a in angles] # correspons to uncertainty levels

    plot_topoplot!(
        f[1:6, 1],
        topo_array[:, tp, 1];
        positions = topo_positions,
        topo_attributes = (;
            label_scatter = (;
                markersize = 20,
                marker = '↑',
                color = :gray, strokecolor = :black, strokewidth = 1,
                rotation = rotations,
            )
        ),
        axis = (; xlabel = "Time point $tp", xlabelsize = 24, ylabelsize = 24),
        visual = (; colormap = :diverging_tritanopic_cwr_75_98_c20_n256, contours = false),
        colorbar = (; labelsize = 24, ticklabelsize = 18),
    )

    mgroup = [
        MarkerElement(marker = sym, color = :black, markersize = 20)
        for sym in arrow_symbols
    ]

    Legend(f[7, 1], mgroup, labels, "Some\nmeasure";
        patchlabelsize = 14, framevisible = false,
        labelsize = 18, titlesize = 20,
        orientation = :horizontal, titleposition = :left, margin = (90, 0, 0, 0))
    f
end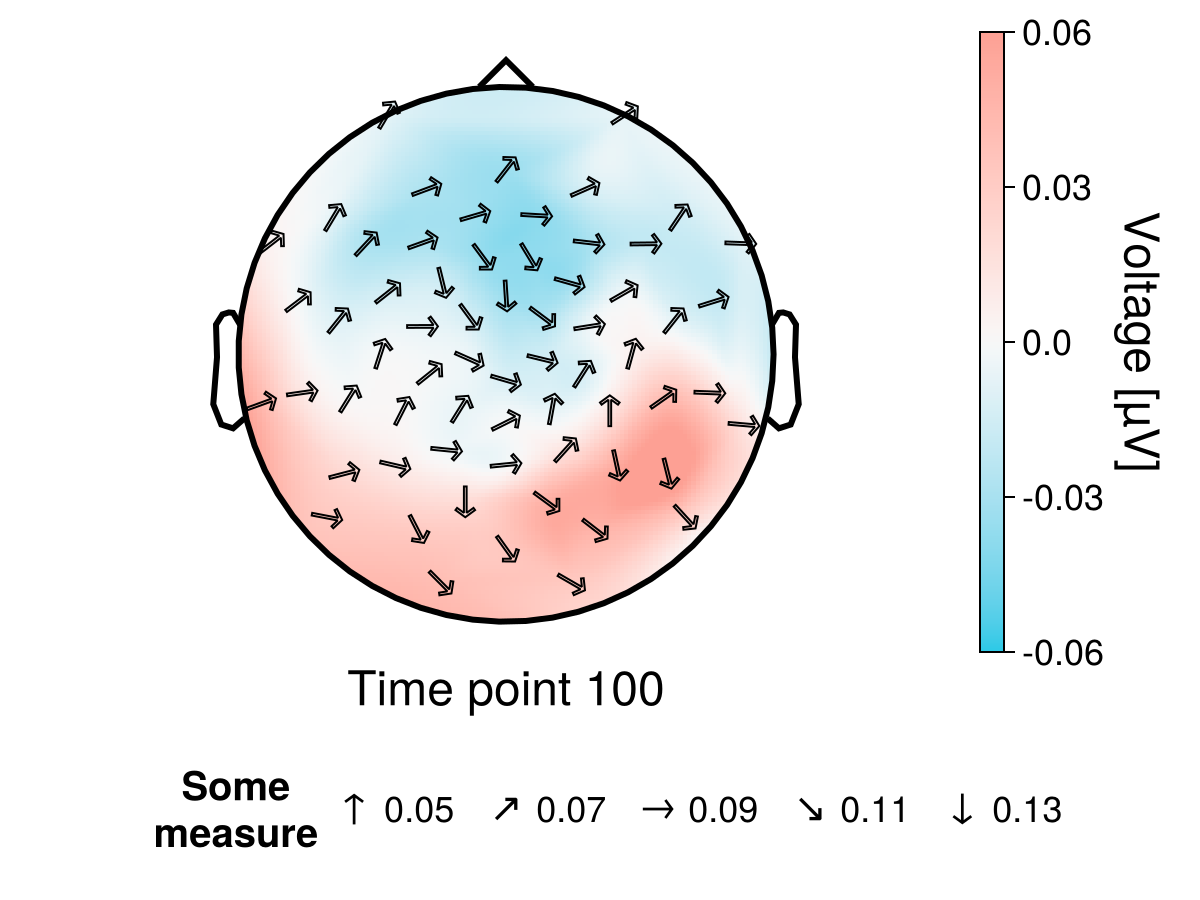
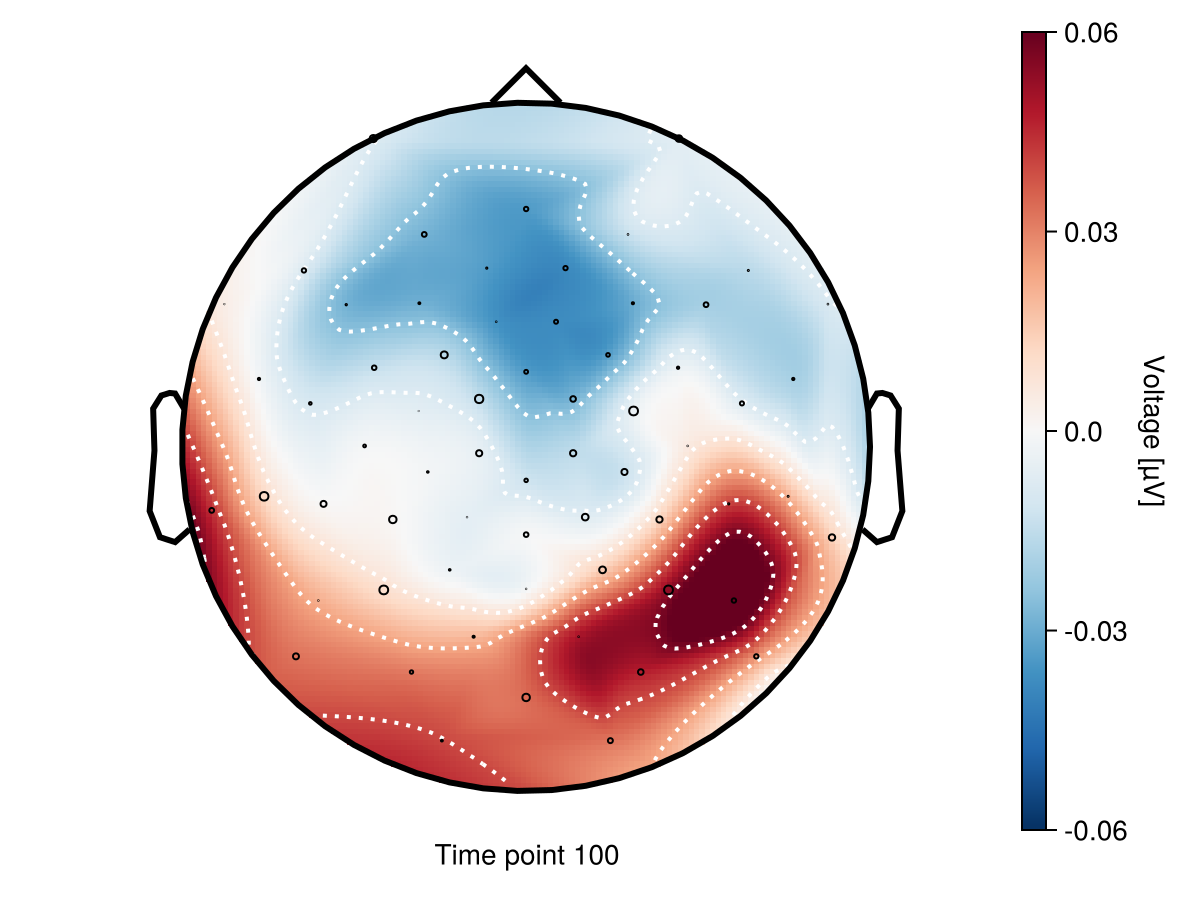
Marker size change
plot_topoplot(
    topo_array[:, tp, 1];
    positions = topo_positions,
    axis = (; xlabel = "Time point $tp"),
    topo_attributes = (;
        label_scatter = (; markersize = rand(64) .* 2π, marker = :circle, color = :black)
    ),
)
Not only voltage
Topoplots can be used to visualize any measure that can be mapped to sensors locations. For example, you can plot statistical values (t-values, F-values, p-values), frequency band power, connectivity measures etc. Here we plot different uncertatinty estimates using topoplot.
topo_se = topo_array[:, tp, 2] ./ sqrt(length(topo_array[:, tp, 2])) # standard error
topo_tvalues = topo_array[:, tp, 1] ./ topo_se
topo_pvalues = -log10.(clamp.(topo_array[:, tp, 3], eps(eltype(topo_array)), 1))

begin
    f = Figure(size = (600, 600))
    ax = Axis(f[1:2, 1:2]; titlesize = 22, subtitlesize = 18,
        title = "Uncertainty measures on topoplots", subtitle = "Time point $tp")
    hidedecorations!(ax); hidespines!(ax)

    panels = [
        (topo_array[:, tp, 2], "Standard deviation"),
        (topo_se, "Standard error"),
        (abs.(topo_tvalues), "|t-values|"),
        (topo_pvalues, "p-values (-log₁₀ scale)"),
    ]

    for (i, (vals, cblabel)) in enumerate(panels)
        r = div(i - 1, 2) + 1   # rows: 1..2
        c = mod(i - 1, 2) + 1   # cols: 1..2

        plot_topoplot!(f[r, c],
            vals;
            positions = topo_positions,
            axis = (; xlabel = ""),
            colorbar = (; vertical = false, position =:bottom, width = 180, label = cblabel),
            visual = (; colormap = :viridis, contours = false),
        )
    end

    f
end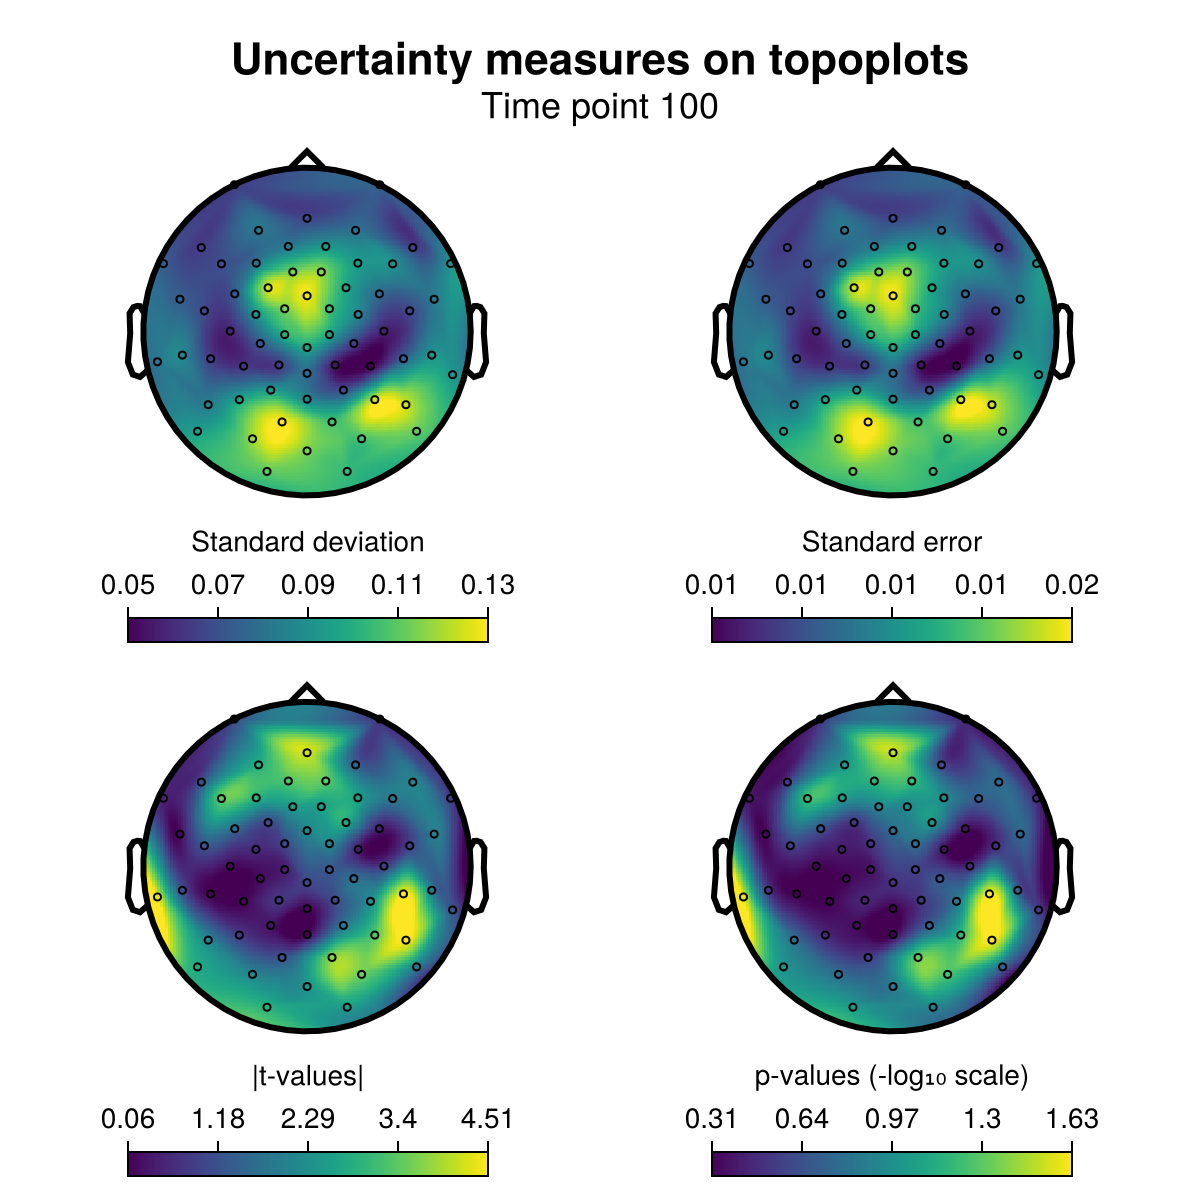
Configurations of Topoplot
UnfoldMakie.plot_topoplot — Function
plot_topoplot!(f::Union{GridPosition, GridLayout, Figure}, data::Union{<:Observable{<:DataFrame},<:AbstractDataFrame,<:AbstractVector}; positions::Vector, labels = nothing, kwargs...)
plot_topoplot(data::Union{<:Observable{<:DataFrame},<:AbstractDataFrame,<:AbstractVector}; position::Vector, labels = nothing, kwargs...)
Plot a topoplot.
Arguments
f::Union{GridPosition, GridLayout, Figure}
Figure,GridLayout, orGridPositionto draw the plot.data::Union{<:Observable{<:DataFrame},<:AbstractDataFrame,<:AbstractVector}
Data for the plot visualization.positions::Vector{Point{2, Float32}}
Positions used ifdatais not aDataFrame. Positions are generated fromlabelsifpositions = nothing.labels::Vector{String} = nothing
Labels used ifdatais not a DataFrame.topo_axis::NamedTuple = (;)
Here you can flexibly change configurations of the topoplot axis.
To see all options just type?Axisin REPL.
Defaults: (width = Relative(1.0f0), height = Relative(1.0f0), halign = 0.05, valign = 0.95, aspect = DataAspect())topo_attributes::NamedTuple = (;)
Here you can flexibly change configurations of the topoplot interoplation.
To see all options just type?Topoplot.topoplotin REPL.
Defaults: interp_resolution = (128, 128), interpolation = CloughTocher()
Shared plot configuration options
The shared plot options can be used as follows: type = (; key = value, ...)).
For example, plot_x(...; colorbar = (; vertical = true, label = "Test")).
Multiple defaults will be cycled until match.
Placing ; is important!
figure = NamedTuple() - use kwargs... of Makie.Figure
axis = (xlabel = "Time", aspect = Makie.DataAspect()) - use kwargs... of Makie.Axis
layout = (show_legend = true, use_colorbar = true, hidespines = (), hidedecorations = Dict{Symbol, Bool}(:label => 0)) - check this page
mapping = (x = nothing, y = (:estimate, :yhat, :y), positions = (:pos, :positions, :position, nothing), labels = (:labels, :label, :sensor, nothing)) - use any mapping from AlgebraOfGraphics
visual = (colormap = Makie.Reverse{Symbol}(:RdBu), contours = (color = :white, linewidth = 2), enlarge = 1, label_scatter = true, label_text = false, bounding_geometry = GeometryBasics.Circle) - use kwargs... of Topoplot.eeg_topoplot
legend = (orientation = :vertical, tellwidth = true, tellheight = false, halign = :right, valign = :center) - use kwargs... of Makie.Legend
colorbar = (vertical = true, tellwidth = true, tellheight = false, labelrotation = -1.5707963267948966, flipaxis = true, label = "Voltage [µV]", position = :right) - use kwargs... of Makie.Colorbar
To highlight some electrodes, you can use topo_attributes = (; label_scatter = (; ...)), where ... are the attributes for scatter! function. For example, to change the marker size of all electrodes to 8, use topo_attributes = (; label_scatter = (; markersize = 15)). To set different sizes for each electrode, provide a vector of sizes with length equal to the number of electrodes.
Colorbar limits behavior:
- If you pass
colorbar = (; limits = (lo, hi))orcolorbar = (; colorrange = (lo, hi)), that range is used. - If neither is provided and the data includes negative values, the range is symmetric around zero using 1st/99th percentiles:
p01 = percentile(0.01, data),p99 = percentile(0.99, data),m = max(abs(p01), abs(p99)), then(-m, m). - If the data is non-negative, the range defaults to
(minimum(data), maximum(data)).
Return Value: Figure displaying the Topoplot.
This page was generated using Literate.jl.