Topoplot Series
Topoplot series is a plot type for visualizing EEG activity in a given time frame or time interval. It can fully represent channel and channel location dimensions using contour lines. It can also partially represent the time dimension. Basically, it is a series of Topoplots.
Setup
Package loading
using Unfold
using UnfoldMakie
using DataFrames
using CairoMakie
using TopoPlots
using Statistics
Data input
dat, positions = TopoPlots.example_data()
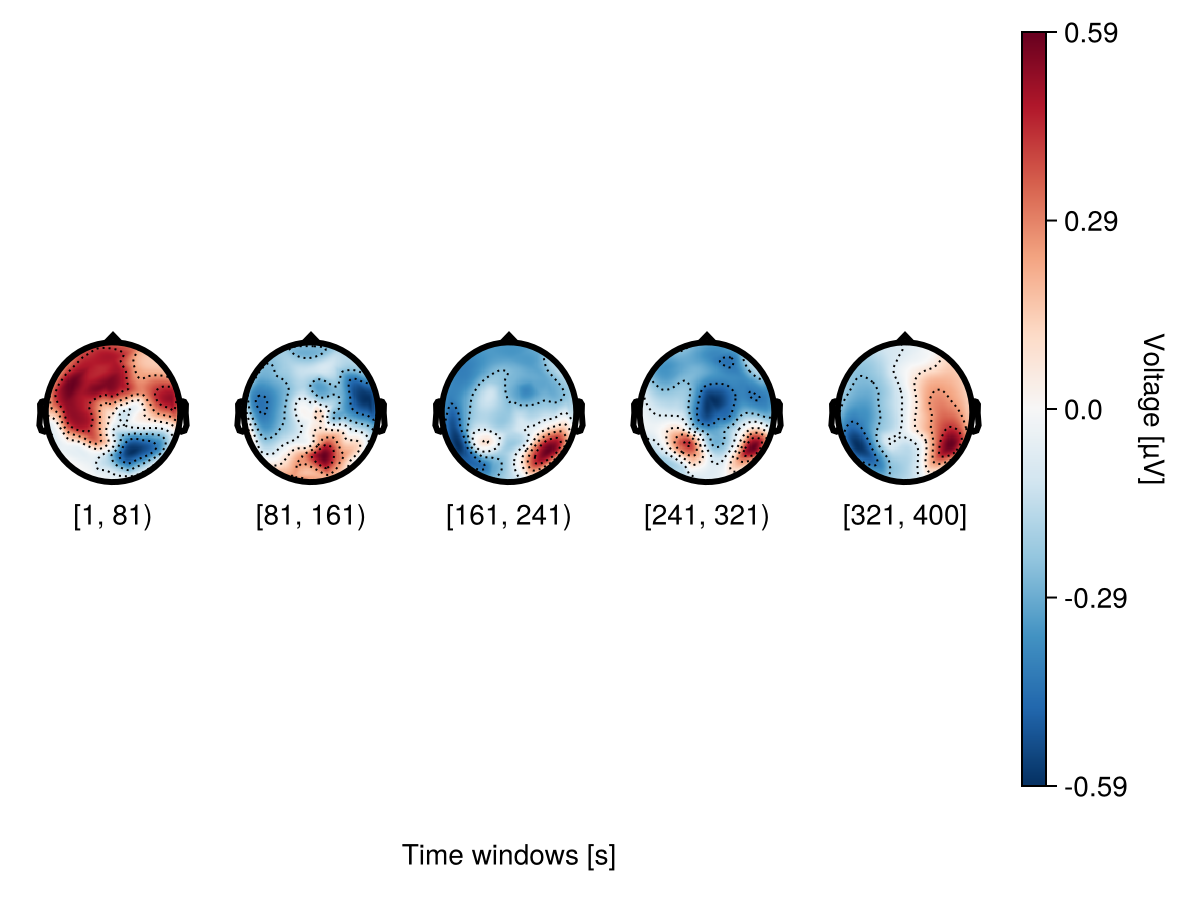
df = UnfoldMakie.eeg_array_to_dataframe(dat[:, :, 1], string.(1:length(positions)));Number of topoplots
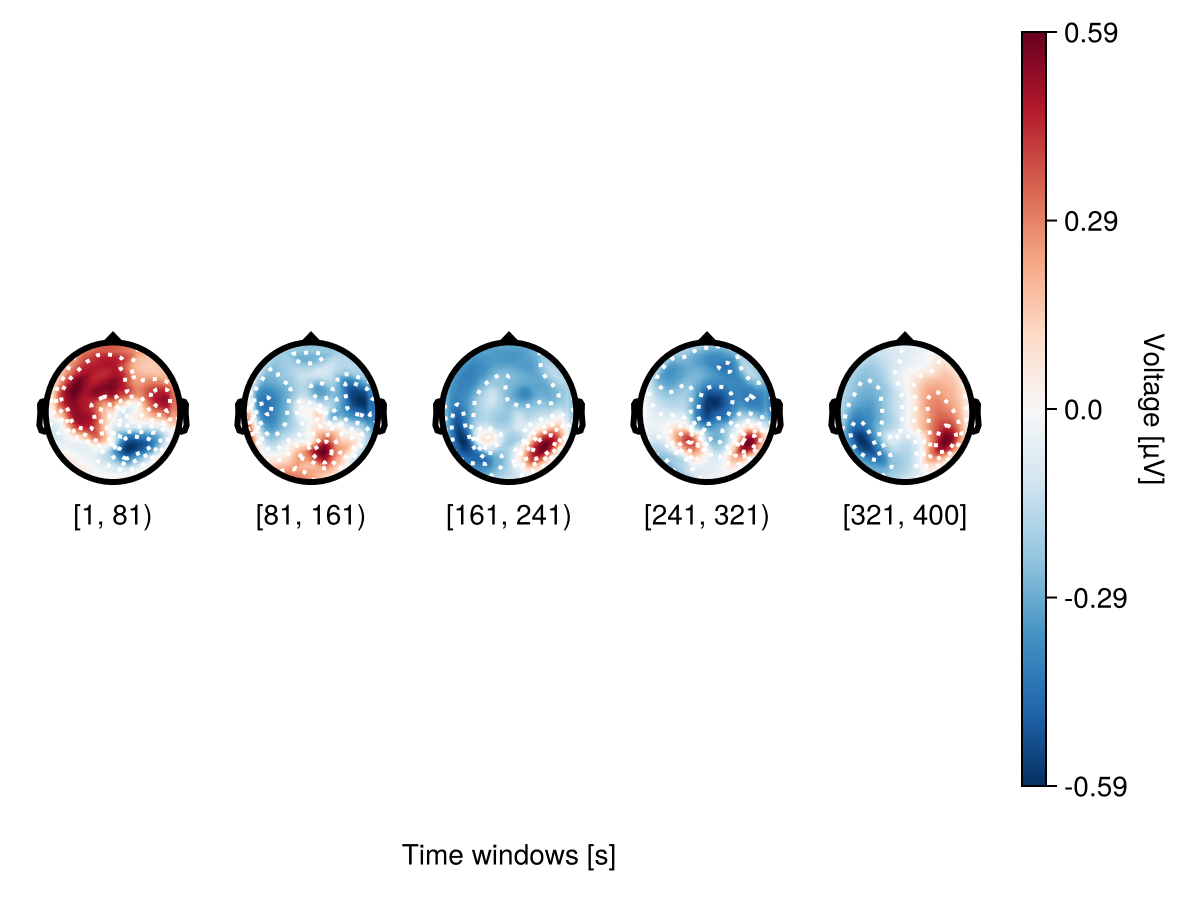
There are two ways to specify the number of topoplots in a topoplot series: bin_width - specify the interval between topoplots
bin_width = 80
plot_topoplotseries(
    df;
    bin_width,
    positions = positions,
    axis = (; xlabel = "Time windows [s]"),
)
bin_num - specify the number of topoplots
plot_topoplotseries(
    df;
    bin_num = 5,
    positions = positions,
    axis = (; xlabel = "Time windows [s]"),
)
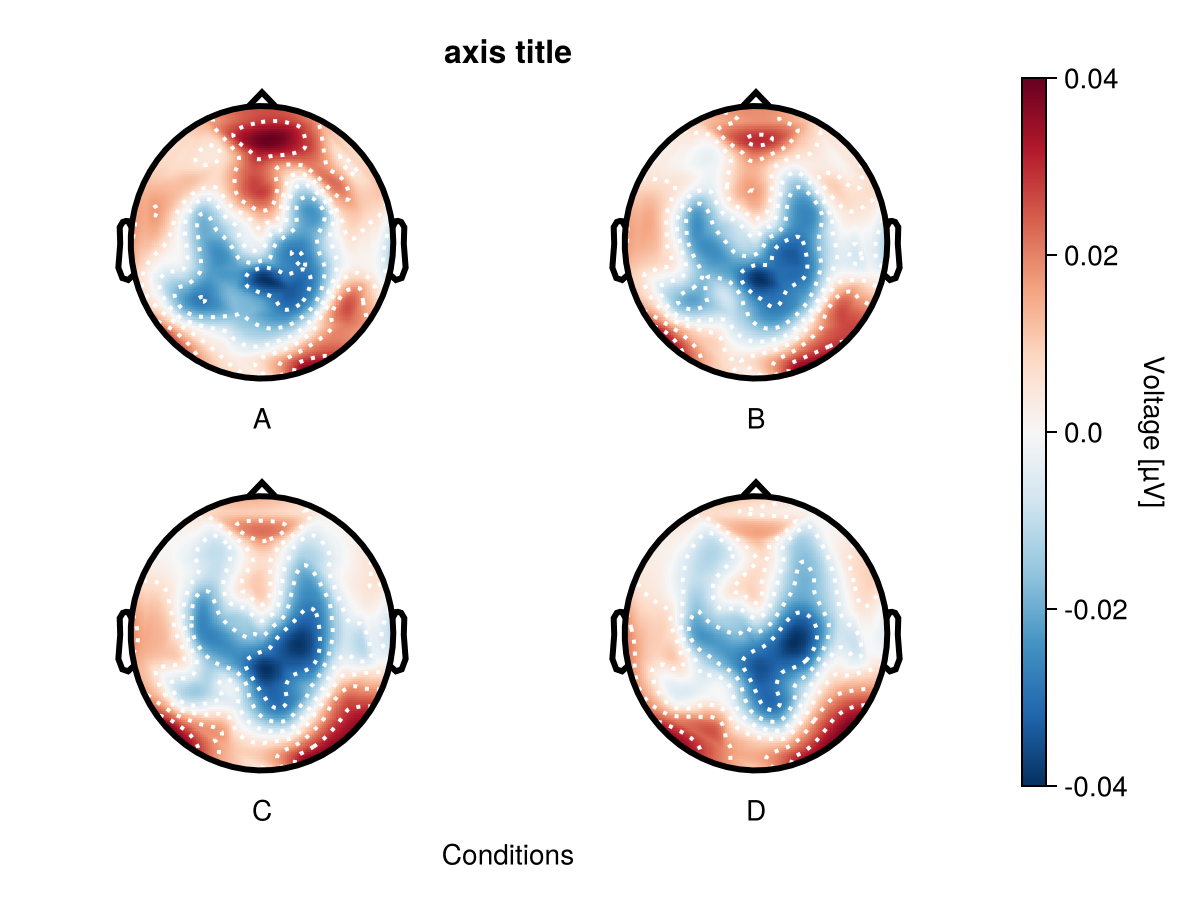
Categorical and contionous x-values
By deafult x-value is time, but it could be any contionous (i.g. saccade amplitude) or categorical (any experimental variable) value.
f = Figure()
df_cat = UnfoldMakie.eeg_array_to_dataframe(dat[:, 1:5, 1], string.(1:length(positions)))
df_cat.condition = repeat(["A", "B", "C", "D", "E"], size(df_cat, 1) ÷ 5)

plot_topoplotseries!(
    f[1, 1],
    df_cat;
    nrows = 2,
    mapping = (; col = :condition),
    axis = (; xlabel = "Conditions"),
    positions = positions,
)
f
To create topoplot series with categorical values:
- Do not specify
bin_widthorbin_num. - Put categorical value in
mapping.col.
Additional features
Adjusting individual topoplots
By using topoplot_axes you can flexibly change configurations of topoplots.
df_adj = UnfoldMakie.eeg_array_to_dataframe(dat[:, 1:4, 1], string.(1:length(positions)))
df_adj.condition = repeat(["A", "B", "C", "D"], size(df_adj, 1) ÷ 4)

plot_topoplotseries(
    df_adj;
    nrows = 2,
    positions = positions,
    mapping = (; col = :condition),
    axis = (; title = "axis title", xlabel = "Conditions"),
    topoplot_axes = (;
        rightspinevisible = true,
        xlabelvisible = false,
        title = "single topoplot title",
    ),
)
Adjusting column gaps
Using colgap in with_theme helps to adjust column gaps.
with_theme(colgap = 5) do
    plot_topoplotseries(
        df,
        bin_num = 5;
        positions = positions,
        axis = (; xlabel = "Time windows [s]"),
    )
end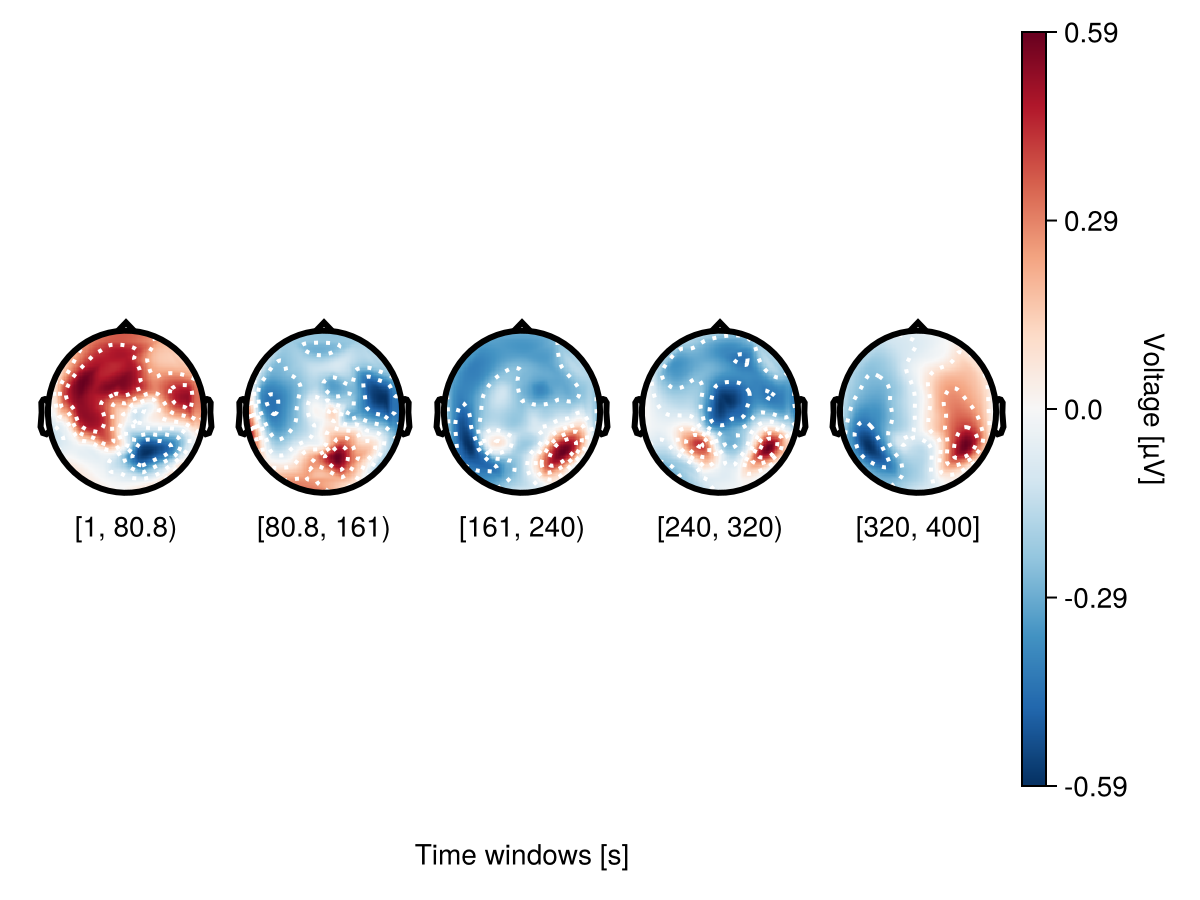
However it doesn't work with subsets. Here you need to use topoplot_axes.limits.
begin
    f = Figure()
    plot_topoplotseries!(
        f[1, 1],
        df,
        bin_num = 5;
        positions = positions,
        topoplot_axes = (; limits = (-0.05, 1.05, -0.1, 1.05)),
        axis = (; xlabel = "Time windows [s]"),
    )
    f
end
Adjusting contours
Topographic contour is a line drawn on a topographic map to indicate an increase or decrease in voltage. A contour level is an area with a specific range of voltage. By default, the number of contour levels is 6, which means that the topography plot is divided into 6 areas depending on their voltage values.
plot_topoplotseries(
    df;
    bin_width,
    positions = positions,
    visual = (; enlarge = 0.9, contours = (; linewidth = 1, color = :black)),
    axis = (; xlabel = "Time windows [s]"),
)
Aggregating functions
In this example combinefun is specified by mean, median and std.
f = Figure(size = (500, 500))
plot_topoplotseries!(
    f[1, 1],
    df;
    bin_width,
    positions = positions,
    combinefun = mean,
    axis = (; xlabel = "", title = "combinefun = mean"),
)
plot_topoplotseries!(
    f[2, 1],
    df;
    bin_width,
    positions = positions,
    combinefun = median,
    axis = (; xlabel = "", title = "combinefun = median"),
)
plot_topoplotseries!(
    f[3, 1],
    df;
    bin_width,
    positions = positions,
    combinefun = std,
    axis = (; title = "combinefun = std", xlabel = "Time windows [s]"),
)
f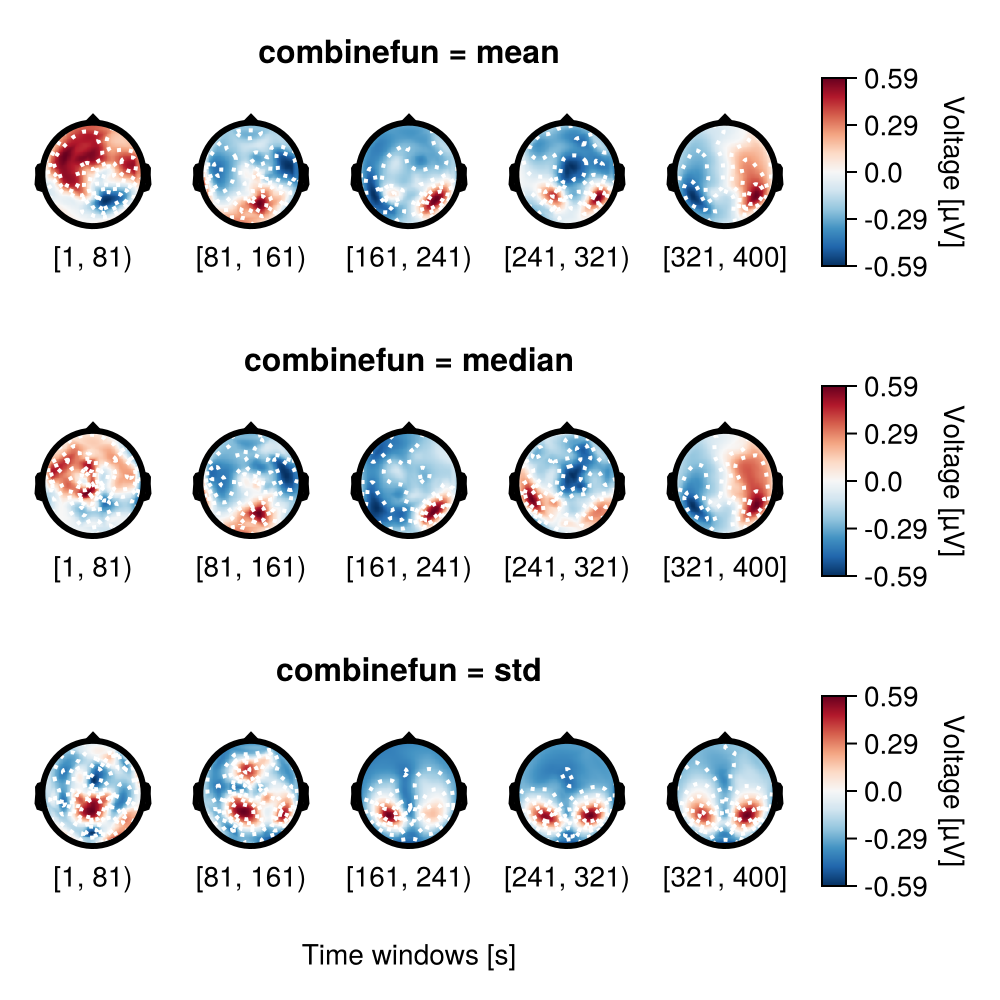
Multiple rows
Use nrows to specify multiple rows.
f = Figure()
df_col = UnfoldMakie.eeg_array_to_dataframe(dat[:, :, 1], string.(1:length(positions)))
plot_topoplotseries!(
    f[1, 1:5],
    df_col;
    bin_num = 16,
    nrows = 4,
    positions = positions,
    visual = (; label_scatter = false, contours = false),
    axis = (; xlabel = "Time windows [s]"),
)
f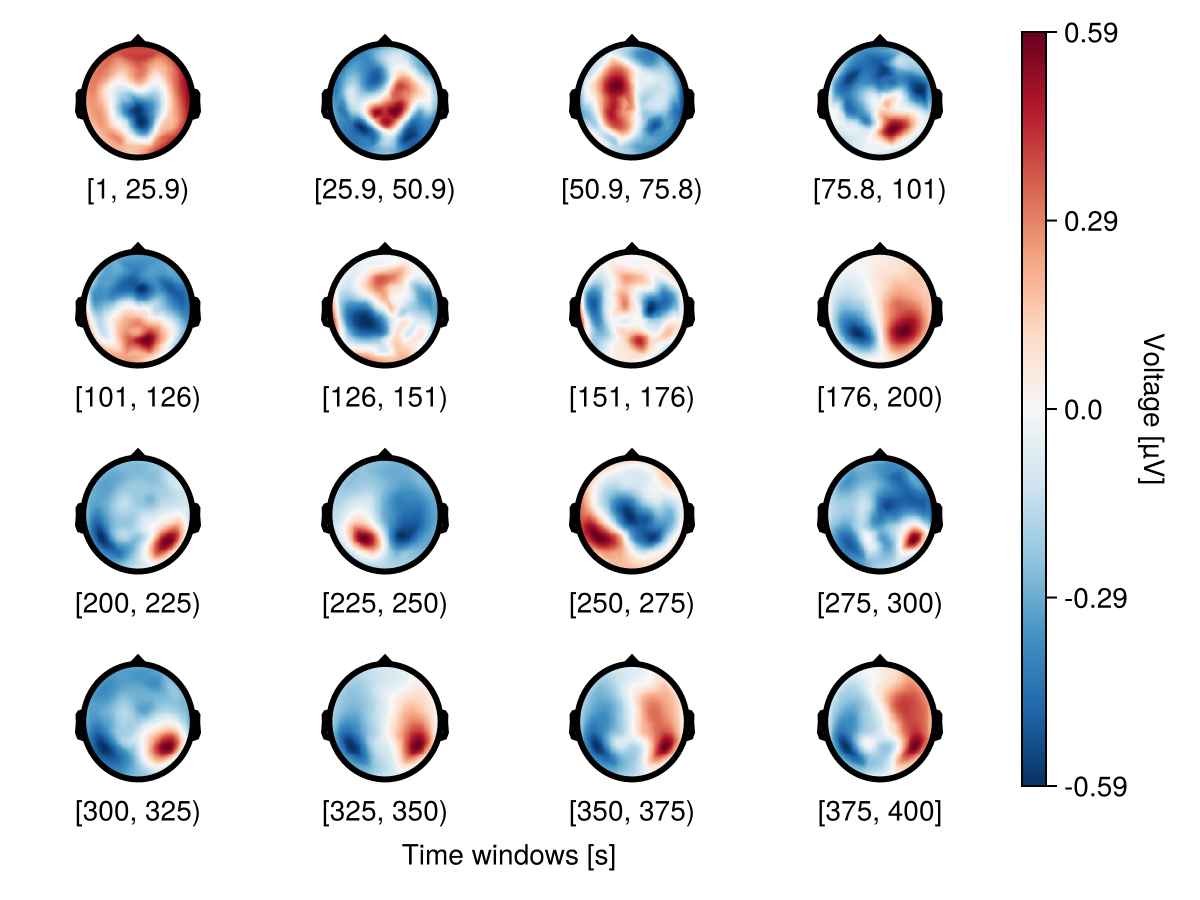
Row mapping
Use mapping.row to specify faceting by condition.
df = UnfoldMakie.eeg_array_to_dataframe(dat[:, 1:12, 1], string.(1:length(positions)))
df.condition = repeat(repeat(["A", "B", "C"], inner = 4), 64)
df.time = repeat(repeat([1, 2, 3, 4], outer = 3), 64)

with_theme(rowgap = 0) do
    plot_topoplotseries(
        df;
        bin_num = 4,
        positions = positions,
        mapping = (; row = :condition),
    )
end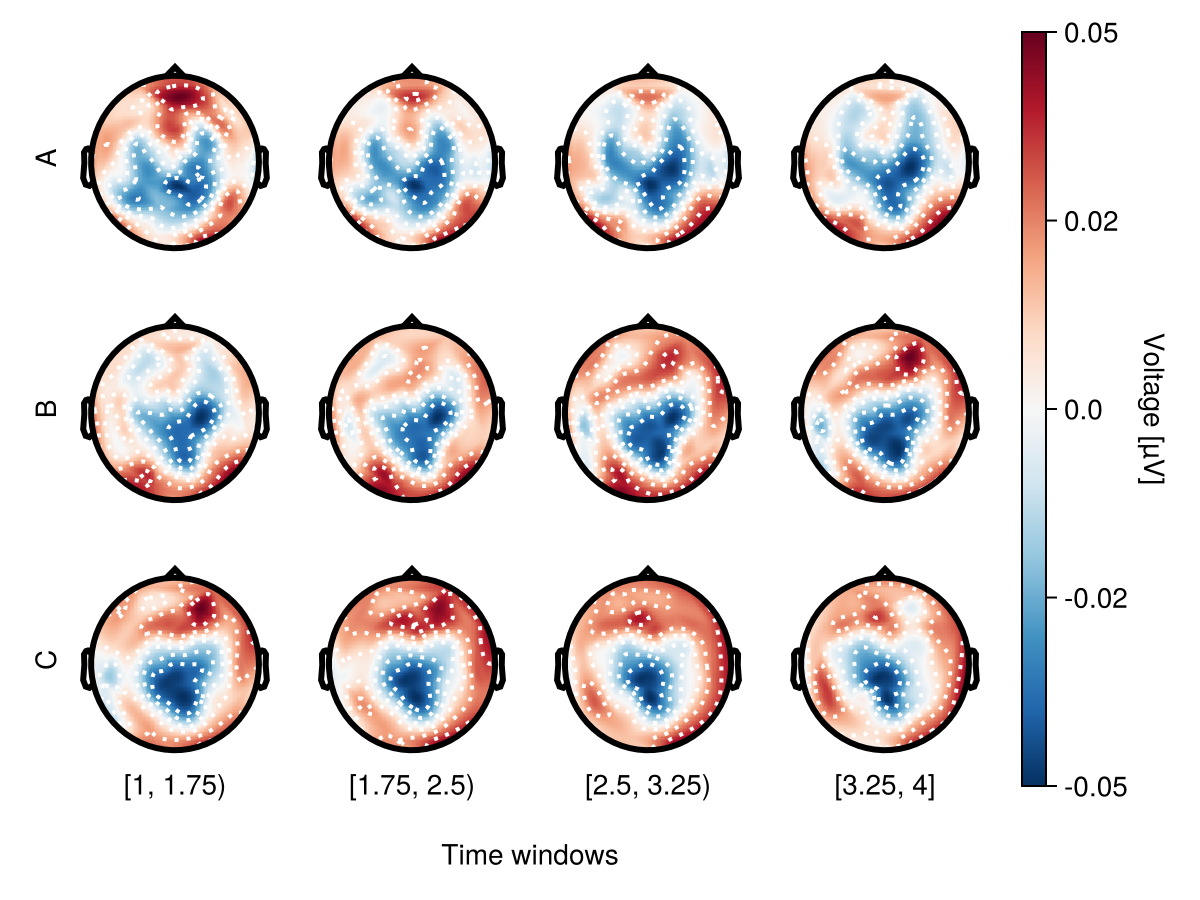
Channel labels
Use visual to specify channel labelss and channels markers. visual.label_text = true makes channel names visible.
begin
    f = Figure()
    df_col = UnfoldMakie.eeg_array_to_dataframe(dat[1:4, :, 1], string.(1:4))
    labs4 = ["s1", "s2", "s3", "s4"]
    plot_topoplotseries!(
        f[1, 1:5],
        df_col;
        bin_num = 2,
        positions = positions[4:7],
        labels = labs4,
        visual = (;
            label_scatter = (
                markersize = 15,
                color = "white",
                strokecolor = "green",
                strokewidth = 2,
            ),
            label_text = true,
        ),
        axis = (; xlabel = "Time windows [s]"),
    )
    f
end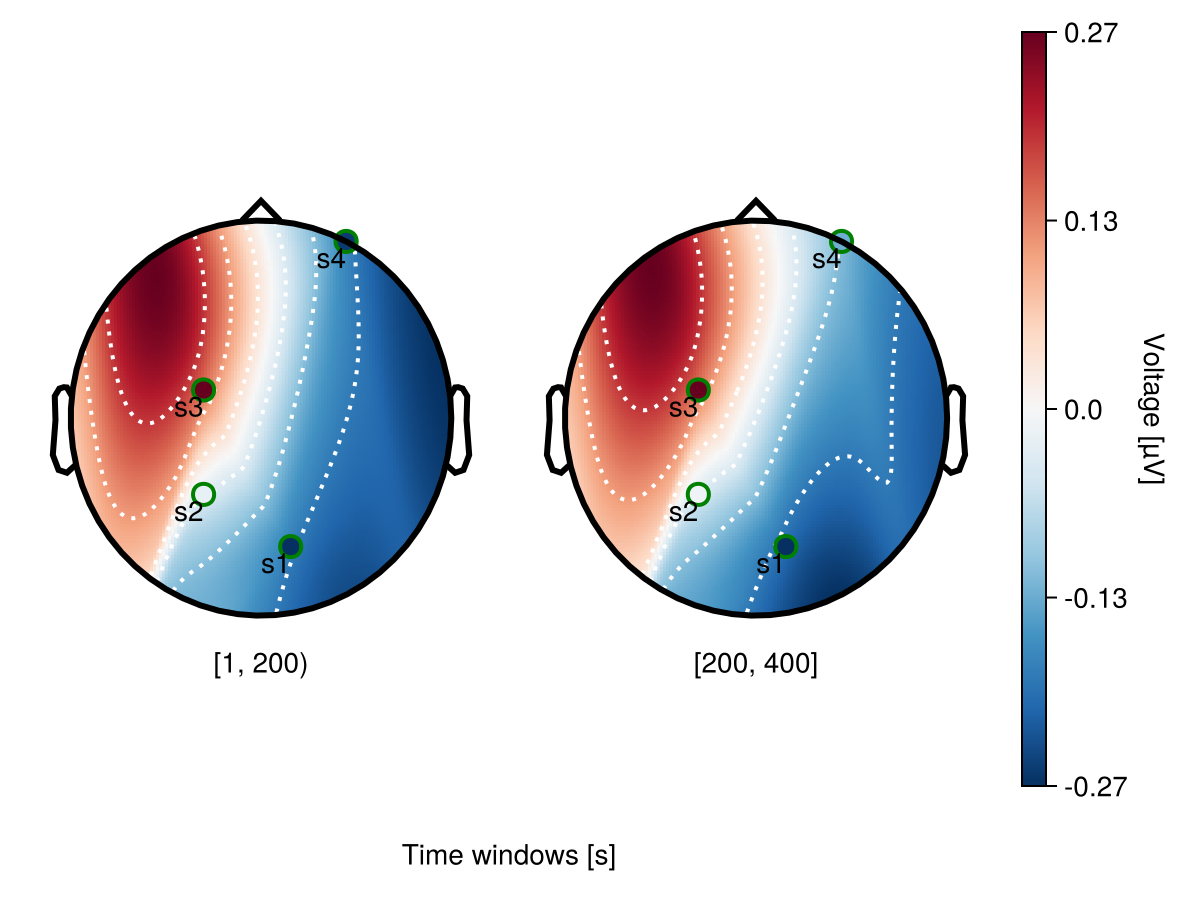
Configurations of Topoplot series
Also you can:
- Label the x-axis with
axis.xlabel. - Hide electrode markers with
visual.label_scatter. - Change the color map with
visual.colormap. The default isReverse(:RdBu). - Adjust the limits of the topoplot boxes with
axis.xlim_topoandaxis.ylim_topo. By default both are(-0.25, 0.25). - Adjust the size of the figure with
Figure(size = (x, y)). - Adjust the padding between topoplot labels and axis labels using
xlabelpaddingandylabelpadding.
UnfoldMakie.plot_topoplotseries — Function
plot_topoplotseries(f::Union{GridPosition, GridLayout, Figure}, data::Union{<:Observable{<:DataFrame},DataFrame}; kwargs...)
plot_topoplotseries!(data::Union{<:Observable{<:DataFrame},DataFrame}; kwargs...)
Multiple miniature topoplots in regular distances.
Arguments
f::Union{GridPosition, GridLayout, GridLayoutBase.GridSubposition, Figure}
Figure,GridLayout,GridPosition, orGridLayoutBase.GridSubpositionto draw the plot.data::Union{<:Observable{<:DataFrame},DataFrame}
DataFrame with data or Observable DataFrame.
Requires atimecolumn by default, but can be overridden by specifyingmapping=(; x=:my_column)with any continuous or categorical column.
Keyword arguments (kwargs)
bin_width::Real = nothing
Number specifing the width of bin of continuous x-value in its units.bin_num::Real = nothing
Number of topoplots.
Eitherbin_width, orbin_numshould be specified. Error if they are both specified
Ifmapping.colormapping.roware categoricalbin_widthandbin_numstay asnothing.combinefun::Function = mean
Specify how the samples withinbin_widthare summarised.
Example functions:mean,median,std.rasterize_heatmaps::Bool = true
Force rasterization of the plot heatmap when saving insvgformat.
Except for the interpolated heatmap, all lines/points are vectors.
This is typically what you want, otherwise you get ~128x128 vectors per topoplot, which makes everything very slow.col_labels::Bool,row_labels::Bool = true
Shows column and row labels in faceting mode. (not implemented)positions::Vector{Point{2, Float32}} = nothing
Specify channel positions. Requires the list of x and y positions for all unique electrodes.labels::Vector{String} = nothing
Show labels for each electrode.interactive_scatter = nothing
Enable interactive mode.
If you createobs_tuple = Observable((0, 0, 0))and pass it intointeractive_scatteryou can update the observable tuple with the indices of the clicked topoplot markers.
(0, 0, 0)corresponds to the (row of topoplot layout, column of topoplot layout, electrode).topo_axis::NamedTuple = (;)
Here you can flexibly change configurations of topoplots.
To see all options just type?Axisin REPL.mapping = (; col = :time, row = nothing, layout = nothing)
mapping.col- specify x-value, can be any continuous or categorical variable.
mapping.row- specify y-value, can be any continuous or categorical variable (not implemented yet).
mapping.layout- arranges topoplots by rows when equals:time.topo_attributes::NamedTuple = (;)
Here you can flexibly change configurations of the topoplot interoplation.
To see all options just type?Topoplot.topoplotin REPL.
Defaults: interp_resolution = (128, 128), interpolation = CloughTocher()topolabels_rounding = (; sigdigits = 3)
Rounding of the topo_axis labels.
sigdigits- number of significant digits.
digits- number of digits after the decimal point.
Only one ofsigdigitsordigitsshould be provided.
Shared plot configuration options
The shared plot options can be used as follows: type = (; key = value, ...)).
For example, plot_x(...; colorbar = (; vertical = true, label = "Test")).
Multiple defaults will be cycled until match.
Placing ; is important!
figure = NamedTuple() - use kwargs... of Makie.Figure
axis = (xlabel = "Time windows", aspect = Makie.DataAspect(), title = "", titlesize = 16, titlefont = :bold, ylabel = "", ylabelpadding = 25, xlabelpadding = 25, xpanlock = true, ypanlock = true, xzoomlock = true, yzoomlock = true, xrectzoom = false, yrectzoom = false) - use kwargs... of Makie.Axis
layout = (show_legend = true, use_colorbar = true, hidespines = (), hidedecorations = Dict{Symbol, Bool}(:label => 0)) - check this page
mapping = (x = nothing, y = (:estimate, :yhat, :y), positions = (:pos, :positions, :position, nothing), labels = (:labels, :label, :sensor, nothing), col = (:time,), row = (nothing,)) - use any mapping from AlgebraOfGraphics
visual = (colormap = Makie.Reverse{Symbol}(:RdBu), contours = (color = :white, linewidth = 2), enlarge = 1, label_scatter = false, label_text = false, bounding_geometry = GeometryBasics.Circle, levels = nothing) - use kwargs... of Topoplot.eeg_topoplot
legend = (orientation = :vertical, tellwidth = true, tellheight = false, halign = :right, valign = :center) - use kwargs... of Makie.Legend
colorbar = (vertical = true, tellwidth = true, tellheight = false, labelrotation = -1.5707963267948966, flipaxis = true, label = "Voltage [µV]", position = :right) - use kwargs... of Makie.Colorbar
Return Value: Figure displaying the Topoplot series.
This page was generated using Literate.jl.