Channel image
Channel image is a plot type for visualizing EEG activity for all channels. It can fully represent time and channel dimensions using a heatmap. Y-axis represents all channels, x-axis represents time, while color represents voltage.
Setup
Package loading
using Unfold
using UnfoldMakie
using CairoMakie
using UnfoldSim
using TopoPlots
Plot Channel image
The following code will result in the default configuration.
dat, pos = TopoPlots.example_data()
dat = dat[:, :, 1]
pos = pos[1:30]
labels_30 = UnfoldMakie.example_montage("labels_30");


plot_channelimage(dat[1:30, :], pos, labels_30; axis = (; xlabel = "Time [s]"))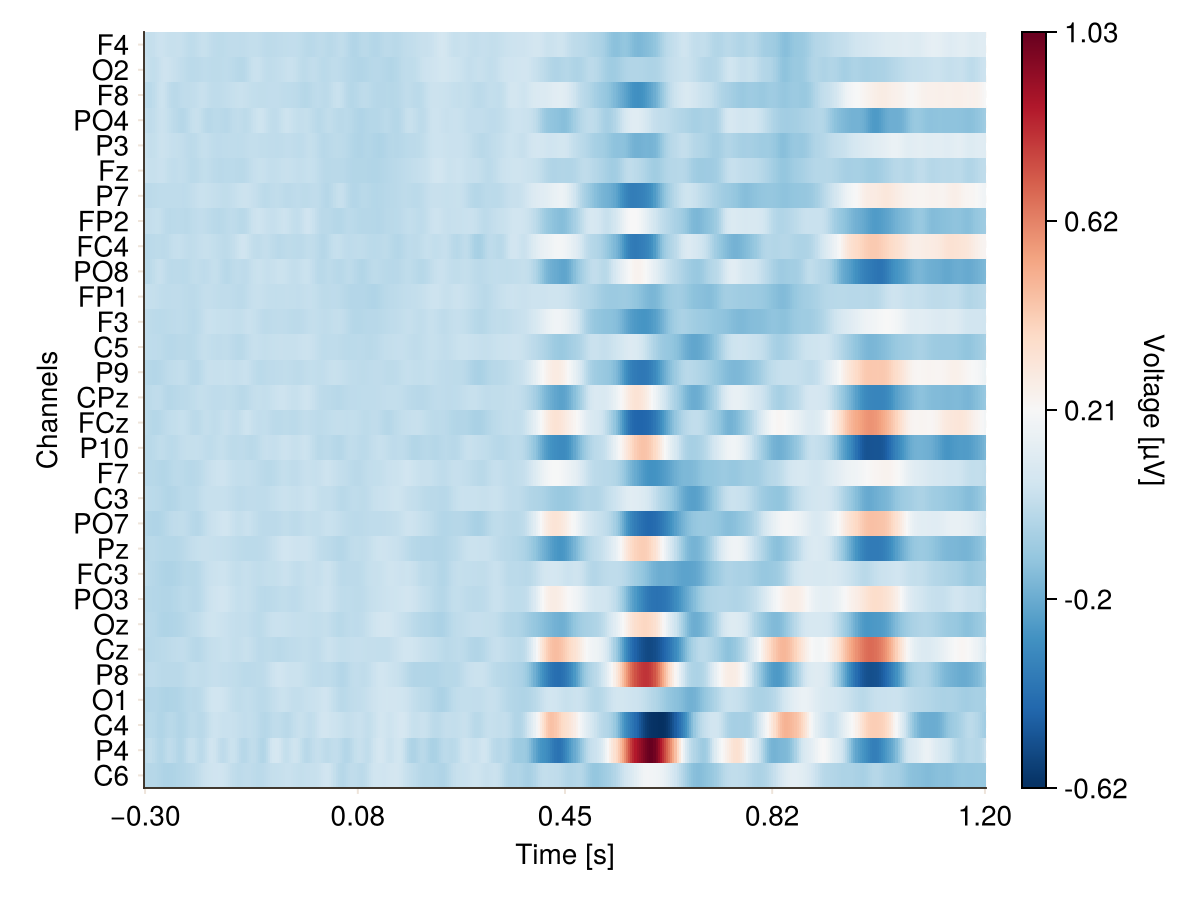
Configurations for Channel image
UnfoldMakie.plot_channelimage — Function
plot_channelimage!(f::Union{GridPosition, GridLayout, Figure}, data::Union{DataFrame,AbstractMatrix}, positions::Vector{Point{2,Float32}}, ch_names::Vector{String}; kwargs...)
plot_channelimage(data::Union{DataFrame, AbstractMatrix}, positions::Vector{Point{2,Float32}}, ch_names::Vector{String}; kwargs...)
Plot a Channel image
Arguments
f::Union{GridPosition, GridLayout, Figure}
Figure,GridLayout, orGridPositionto draw the plot.data::Union{DataFrame, AbstractMatrix}
DataFrame or Matrix with data.
Data should has a format of 1 row - 1 channel.positions::Vector{Point{2,Float32}}
A vector with EEG layout coordinates.ch_names::Vector{String}
Vector with channel names.times::Vector = range(-0.3, 1.2, length = size(data, 2))
Time range on x-axis.sorting_variables::Vector = [:y, :x]
Method to sort channels on y-axis.
For instance, you can sort by channel positions on the scalp (x, y) or channel name.sorting_reverse::Vector = [:false, :false]
Should sorting variables be reversed or not?
Shared plot configuration options
The shared plot options can be used as follows: type = (; key = value, ...)).
For example, plot_x(...; colorbar = (; vertical = true, label = "Test")).
Multiple defaults will be cycled until match.
Placing ; is important!
figure = NamedTuple() - use kwargs... of Makie.Figure
axis = (xlabel = "Time", ylabel = "Channels", yticklabelsize = 14) - use kwargs... of Makie.Axis
layout = (show_legend = true, use_colorbar = true) - check this page
mapping = (x = (:time,), y = (:estimate, :yhat, :y)) - use any mapping from AlgebraOfGraphics
visual = (colormap = Makie.Reverse{String}("RdBu"),) - use kwargs... of Makie.heatmap
legend = (orientation = :vertical, tellwidth = true, tellheight = false, halign = :right, valign = :center) - use kwargs... of Makie.Legend
colorbar = (vertical = true, tellwidth = true, tellheight = false, labelrotation = -1.5707963267948966, label = "Voltage [µV]") - use kwargs... of Makie.Colorbar
Return Value: Figure displaying the Channel image.
This page was generated using Literate.jl.