ERP plot
ERP plot is plot type for visualisation of Event-related potentials and also regression-ERPs. It can fully represent such data features as time and experimental conditions using lines. Its key feature is the ability to display not only the ERPs themselves but also how they vary as a function of categorical or continuous predictors.
Setup
Package loading
using Unfold
using UnfoldMakie
using DataFrames
using CairoMakie
using DataFramesMeta
using UnfoldSim
Data generation
Let's generate some data. We'll fit a model with a 2 level categorical predictor and a continuous predictor with interaction.
erp_matrix, evts = UnfoldSim.predef_eeg(; noiselevel = 12, return_epoched = true)
erp_matrix = reshape(erp_matrix, (1, size(erp_matrix)...))
f = @formula 0 ~ 1 + condition + continuous
se_solver = (x, y) -> Unfold.solver_default(x, y, stderror = true);

m = fit(
    UnfoldModel,
    Dict(Any => (f, range(0, step = 1 / 100, length = size(erp_matrix, 2)))),
    evts,
    erp_matrix,
    solver = se_solver,
);
results = coeftable(m)
res_effects = effects(Dict(:continuous => -5:0.5:5), m);
┌ Warning: using `Dict(:A=>(@formula,times/basisfunction))` is deprecated, please use `[:A=>(@formula,times/basisfunction)]` from now on
└ @ Unfold ~/.julia/packages/Unfold/bEnCM/src/fit.jl:75Figure plotting
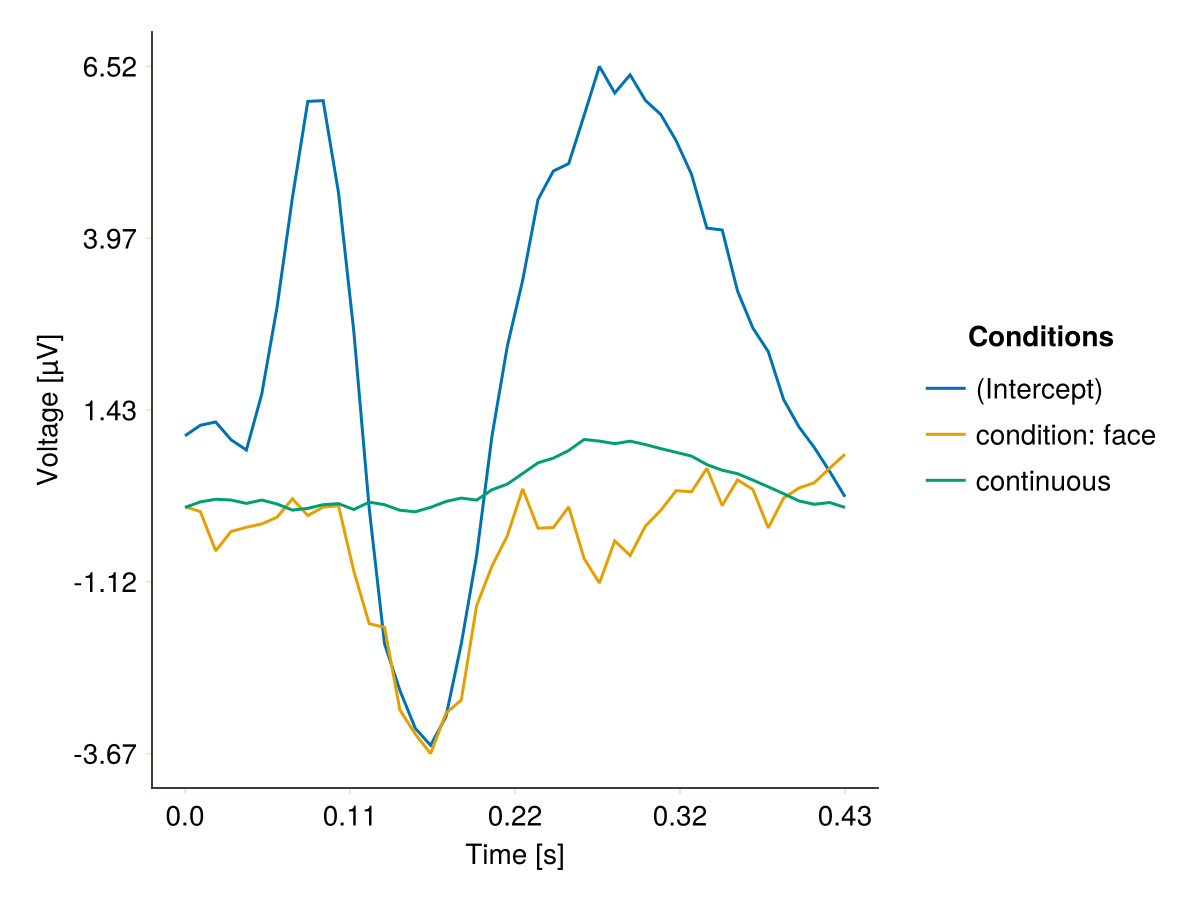
This figure shows the rERP coeffiecients. The "Intercept" reflects the reference category, e.g. the ERP of a "car". The condition "face" reflects the difference to the intercept when a face is shown, and the continuous predictor reflects the slope associated with the linear effect of continuous.
plot_erp(results)
To change legend title use mapping.color:
plot_erp(
    results,
    mapping = (; color = :coefname => "Conditions"),
    axis = (; xlabel = "Time [s]"),
)
Additional features
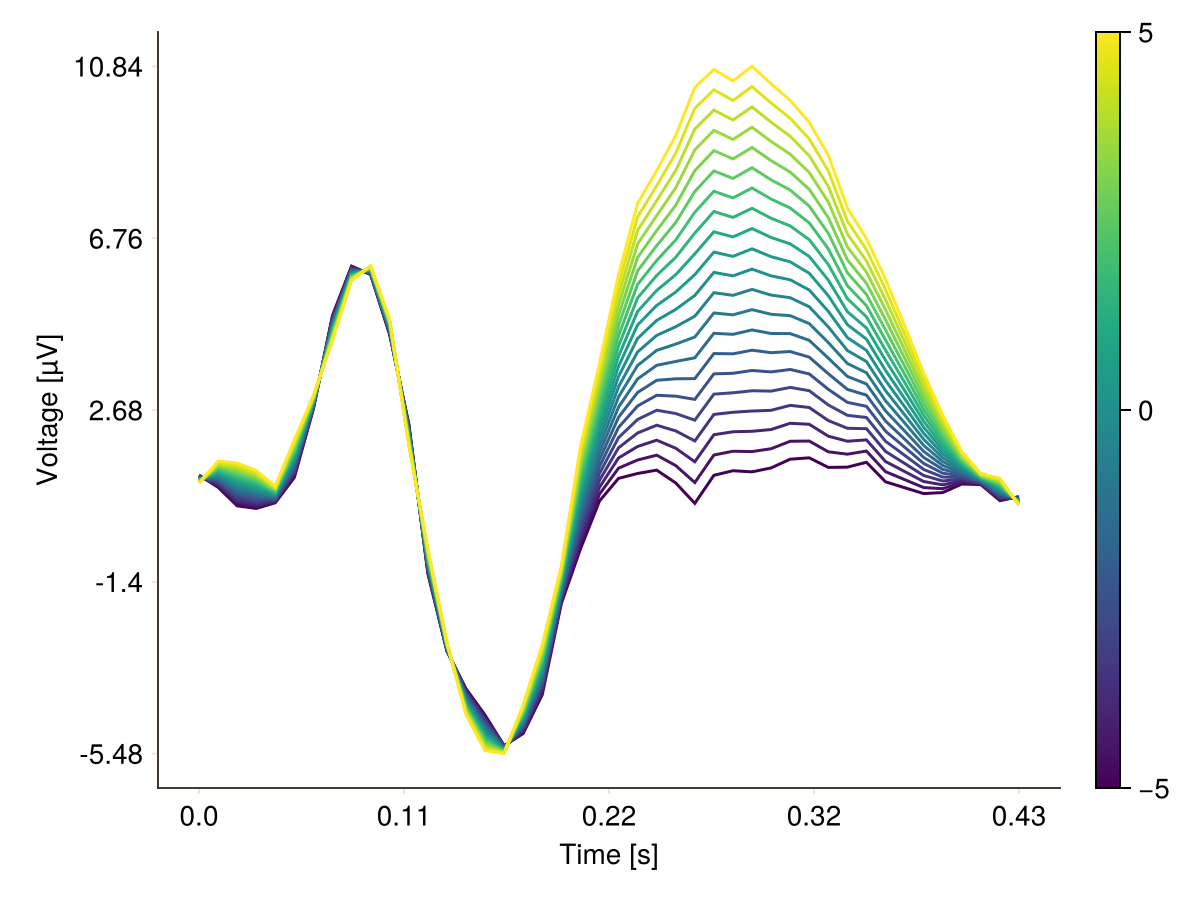
Effect plot
Effect plot shows how the ERP is affected by variation of some variable (here: :continuous).
plot_erp(
    res_effects;
    mapping = (; y = :yhat, color = :continuous, group = :continuous),
    layout = (; use_colorbar = true),
    axis = (; xlabel = "Time [s]"),
)
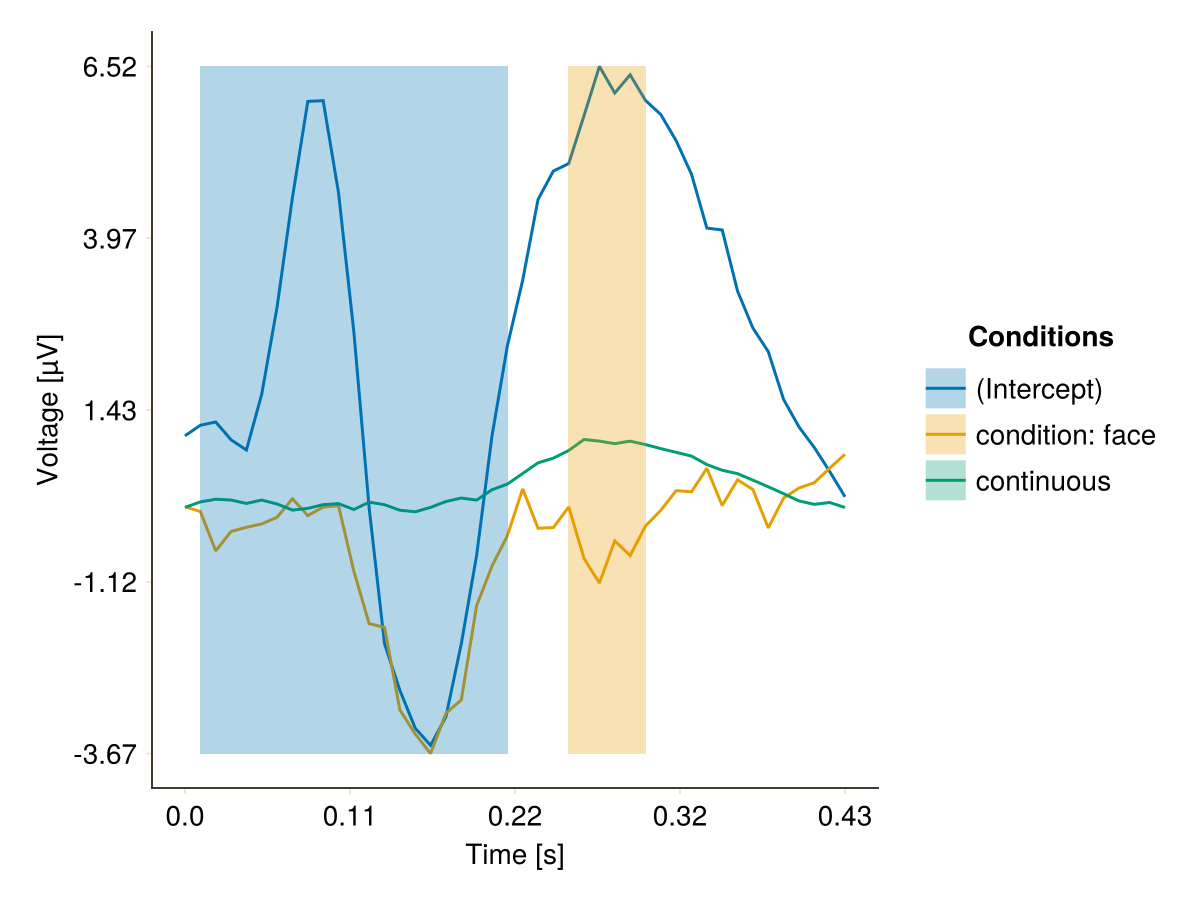
Significance Indicators
Significance indicators visually highlight time intervals where model effects (e.g., regression coefficients) are statistically significant.
Indicators are specified via a significance DataFrame with at least:
fromandto: the time interval to annotate (in seconds or samples)- optionally
coefname: to label and color different effects
The display is controlled using sigifnicance_visual, with options:
:lines— draw horizontal bars below the ERP curve:vspan— draw vertical shaded spans over the time axis:both— show both:none— disable significance indicators entirely
These visual indicators support interpretation of when and where effects occur.
By default, significance is shown as vertical shaded spans.
m = UnfoldMakie.example_data("UnfoldLinearModel")
results = coeftable(m)
significancevalues = DataFrame(
    from = [0.01, 0.25],
    to = [0.2, 0.29],
    coefname = ["(Intercept)", "condition: face"], # if coefname not specified, line should be black
)
plot_erp(
    results;
    :significance => significancevalues,
    mapping = (; color = :coefname => "Conditions"),
    axis = (; xlabel = "Time [s]"),
)
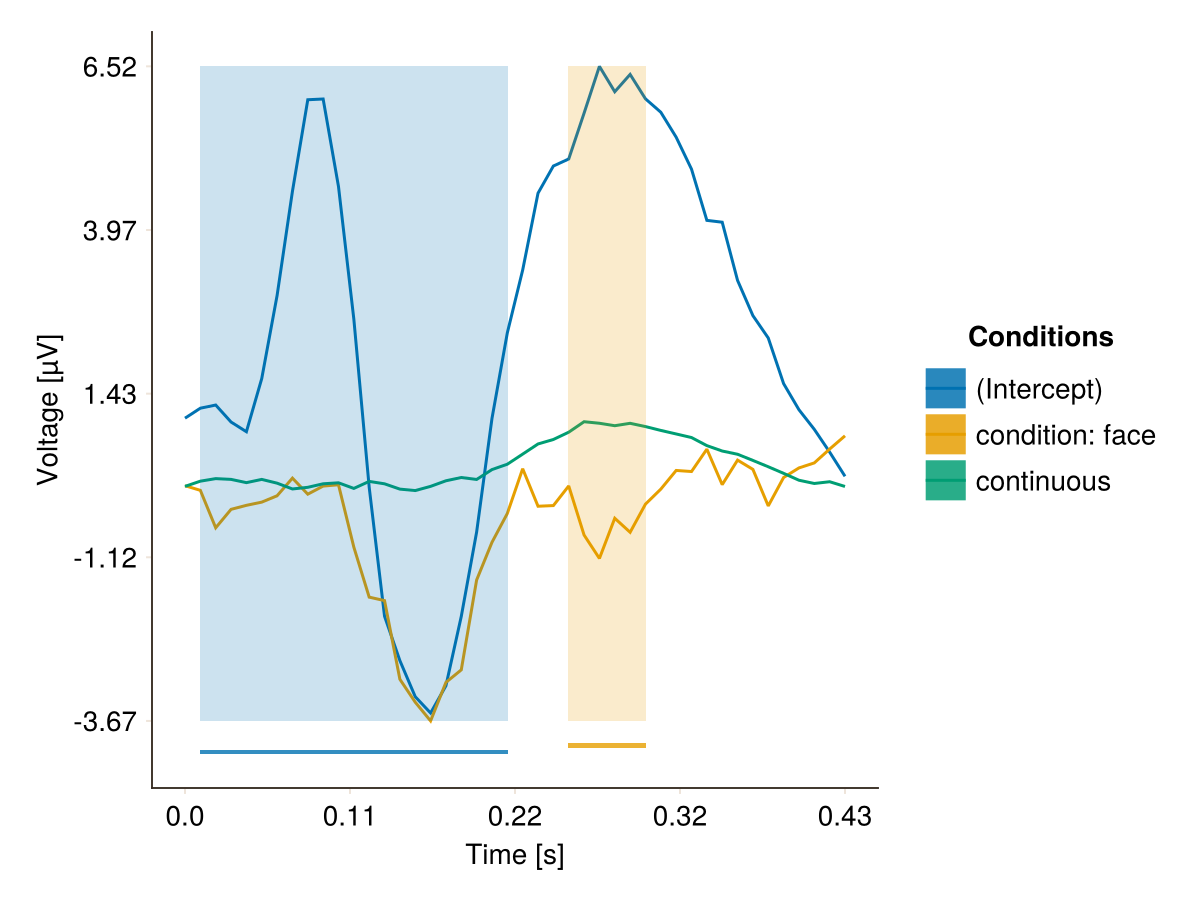
This version shows both horizontal bands and vertical spans
Additional styling is applied:
- Vertical spans: lower alpha (transparency)
- Horizontal bands: increased gap between stacked bands
plot_erp(
    results;
    significance = significancevalues,
    sigifnicance_visual = :both,
    significance_vspan = (; alpha = 0.2),
    significance_lines = (; gap = 0.05, alpha = 0.8),
    mapping = (; color = :coefname => "Conditions"),
    axis = (; xlabel = "Time [s]"),
)
Error ribbons
stderror::bool =false- add an error ribbon, with lower and upper limits based on the:stderrorcolumn.
Display a colored band on the graph to indicate lower and higher estimates based on the standard error. For the generalizability of your results, it is always better to include error bands.
f = Figure()
results.coefname =
    replace(results.coefname, "condition: face" => "face", "(Intercept)" => "car")
results = filter(row -> row.coefname != "continuous", results)
plot_erp!(
    f[1, 1],
    results;
    axis = (title = "Bad example", titlegap = 12, xlabel = ""),
    :stderror => false,
    mapping = (; color = :coefname => "Conditions"),
)

plot_erp!(
    f[2, 1],
    results;
    axis = (title = "Good example", titlegap = 12, xlabel = "Time [s]"),
    :stderror => true,
    mapping = (; color = :coefname => "Conditions"),
)

ax = Axis(f[2, 1], width = Relative(1), height = Relative(1))
xlims!(ax, [-0.04, 1])
ylims!(ax, [-0.04, 1])
hidespines!(ax)
hidedecorations!(ax)
text!(0.98, 0.2, text = "* Confidence\nintervals", align = (:right, :top))
f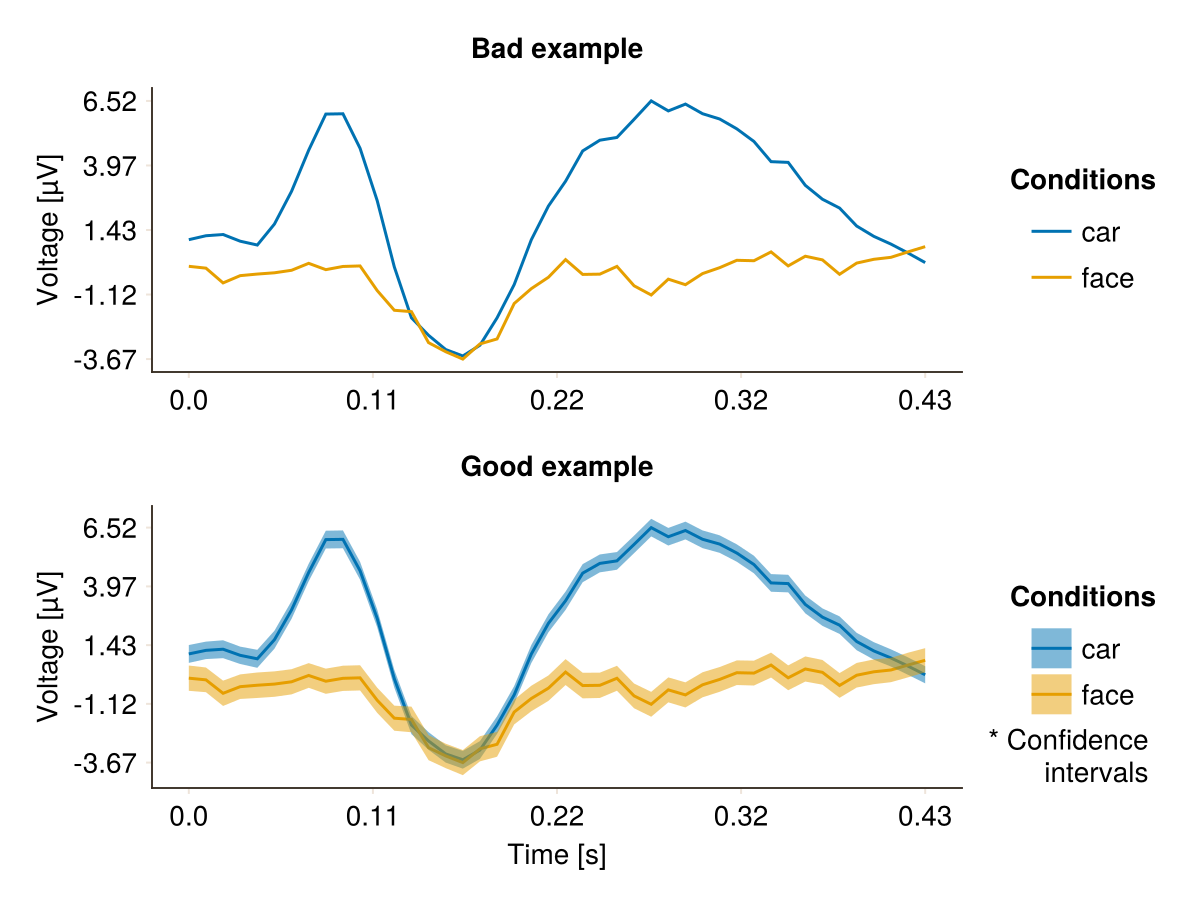
There are two ways to implement it. First is using :stderror = true after ;.
results.se_low = results.estimate .- 0.5
results.se_high = results.estimate .+ 0.15
plot_erp(
    select(results, Not(:stderror));
    stderror = true,
    mapping = (; color = :coefname => "Conditions"),
    axis = (; xlabel = "Time [s]"),
)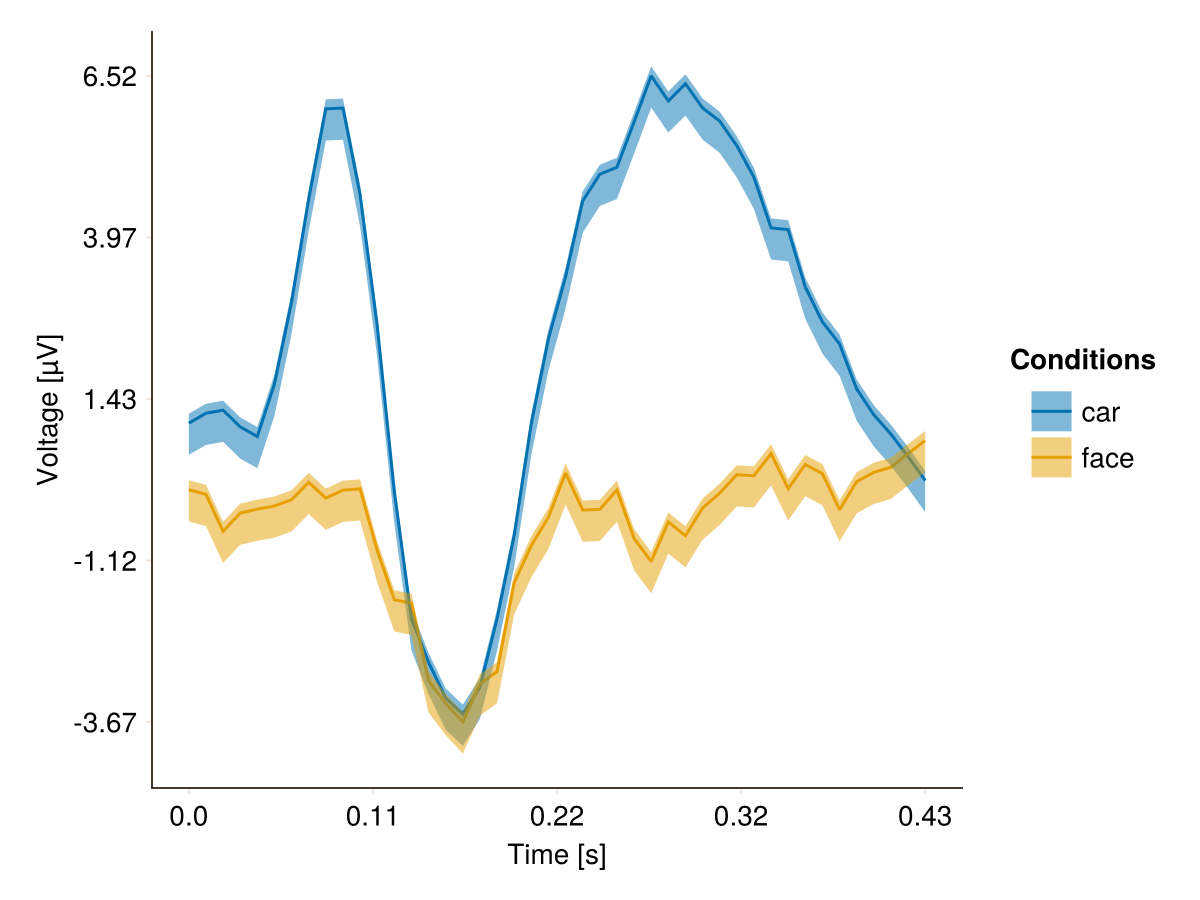
Second way is to specify manually lower and higher borders of the error bands.
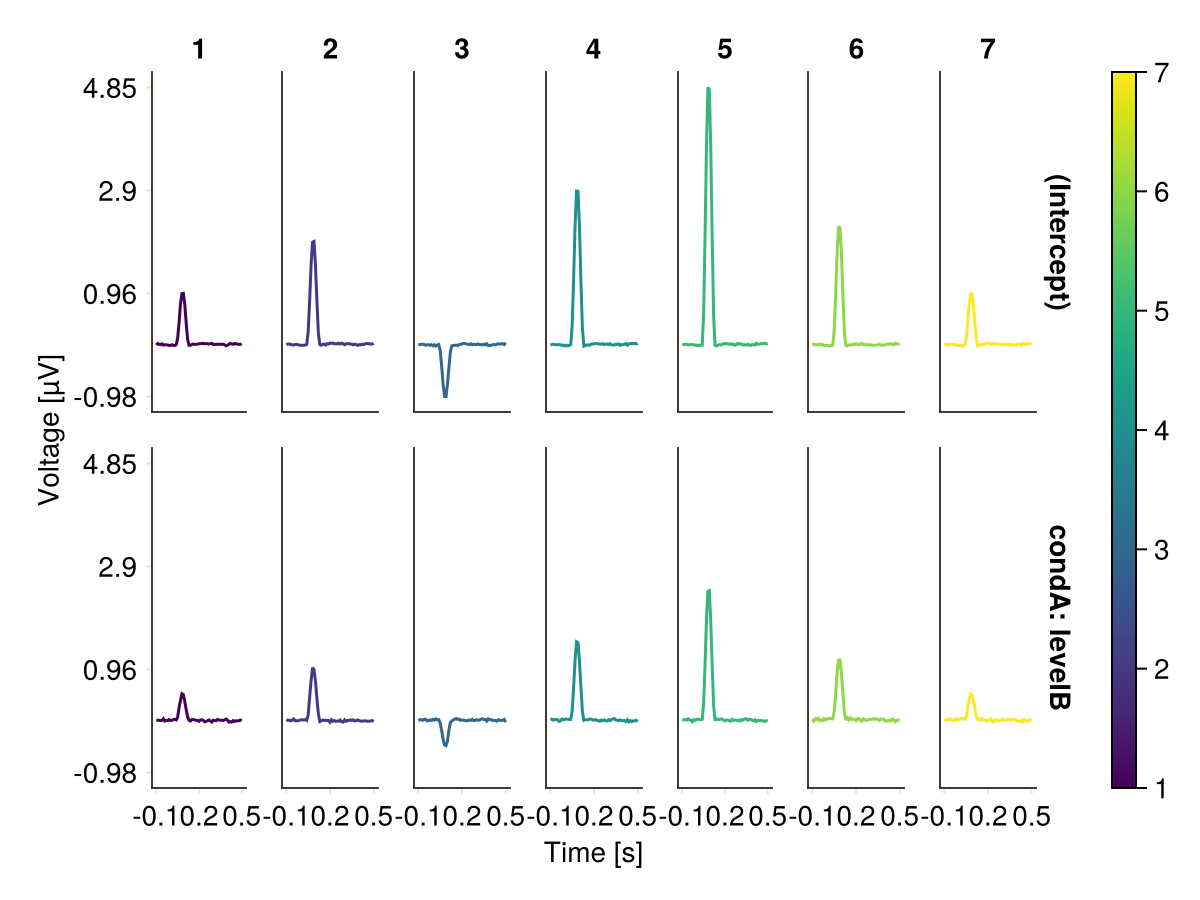
Faceting
Creation of column facets for each channel.
m7 = UnfoldMakie.example_data("7channels")
results7 = coeftable(m7)
plot_erp(
    results7,
    mapping = (; row = :coefname, col = :channel, color = :channel),
    axis = (; xlabel = "Time [s]"),
    nticks = (3, 4),
)
Configurations of ERP plot
UnfoldMakie.plot_erp — Function
plot_erp!(f::Union{GridPosition, GridLayout, Figure}, plot_data::Union{DataFrame, AbstractMatrix, AbstractVector{<:Number}}; kwargs...)
plot_erp(times, plot_data::Union{DataFrame, AbstractMatrix, AbstractVector{<:Number}}; kwargs...)
Plot an ERP plot.
Arguments
f::Union{GridPosition, GridLayout, Figure}
Figure,GridLayout, orGridPositionto draw the plot.data::Union{Union{DataFrame, AbstractMatrix, AbstractVector{<:Number}, Vector{Float32}}
Data for the ERP plot visualization.kwargs...
Additional styling behavior.
Often used as:plot_erp(df; mapping = (; color = :coefname, col = :conditionA)).
Keyword arguments (kwargs)
nticks::Union{Int,Tuple{Int,Int}, NamedTuple{(:x,:y),Tuple{Int,Int}}}= 5
Set the number of tick positions (x,y). Acepts 3 types fo arguments: 6 (=both axes are 6), (5,7), or (x=5, y=7). Controls positions only (use xtickformat/ytickformat for labels).stderror::Bool = false
Add an error ribbon, with lower and upper limits based on the:stderrorcolumn.significance::DataFrame = nothing
Show significant time periods as horizontal bars.
Example:DataFrame(from = [0.1, 0.3], to = [0.5, 0.7], coefname = ["(Intercept)", "condition: face"]).
Ifcoefnameis not specified, the significance lines will be black.layout.use_colorbar = true
Enable or disable colorbar.layout.use_legend = true
Enable or disable legend.layout.show_legend = true
Enable or disable legend and colorbar.tick_formatter::Function = default_ticks
Function used to compute automatic tick positions and labels for both axes.
Example:tick_formatter = v -> default_ticks(v; nticks = 6).mapping = (;)
Specifycolor,col(column),linestyle,group.
F.e.mapping = (; col = :group)will make a column for each group.visual = (; color = Makie.wong_colors, colormap = :roma)
For categorical color usevisual.color, for continuous -visual.colormap.sigifnicance_visual::Symbol = :vspan
How to display significance intervals. Options:
*:vspan– draw vertical shaded spans (default);
*:lines– draw horizontal bands below ERP lines;
*:both– draw both.significance_lines::NamedTuple = (;)
Configure the appearance of significance lines:
*linewidth– thickness of each line (not working);
*gap– vertical space between stacked lines. Computed asstack_step = linewidth + gap;
*alpha– transparency of the lines.
Defaults: (alpha = 1, linewidth = 0.005, gap = 0.1)significance_vspan::NamedTuple = (;)
Control appearance of vertical significance spans:
*alpha– transparency of the shaded area.
Defaults: (alpha = 0.3,)
Shared plot configuration options
The shared plot options can be used as follows: type = (; key = value, ...)).
For example, plot_x(...; colorbar = (; vertical = true, label = "Test")).
Multiple defaults will be cycled until match.
Placing ; is important!
figure = NamedTuple() - use kwargs... of Makie.Figure
axis = (xlabel = "Time [s]", ylabel = "Voltage [µV]", yticklabelsize = 14, xtickformat = UnfoldMakie.var"#PlotConfig##4#PlotConfig##5"(), ytickformat = UnfoldMakie.var"#PlotConfig##6#PlotConfig##7"()) - use kwargs... of Makie.Axis
layout = (show_legend = true, use_colorbar = true, use_legend = true, hidespines = (:r, :t), hidedecorations = Dict{Symbol, Bool}(:grid => 1, :label => 0, :ticks => 0, :ticklabels => 0)) - check this page
mapping = (x = (:time,), y = (:estimate, :yhat, :y), color = (:color, :coefname, nothing)) - use any mapping from AlgebraOfGraphics
visual = (colormap = :roma, color = ColorTypes.RGBA{Float32}[RGBA(0.0, 0.44705883, 0.69803923, 1.0), RGBA(0.9019608, 0.62352943, 0.0, 1.0), RGBA(0.0, 0.61960787, 0.4509804, 1.0), RGBA(0.8, 0.4745098, 0.654902, 1.0), RGBA(0.3372549, 0.7058824, 0.9137255, 1.0), RGBA(0.8352941, 0.36862746, 0.0, 1.0), RGBA(0.9411765, 0.89411765, 0.25882354, 1.0)]) - use kwargs... of Makie.lines
legend = (orientation = :vertical, tellwidth = true, tellheight = false, halign = :right, valign = :center, framevisible = false, position = :right) - use kwargs... of Makie.Legend
colorbar = (vertical = true, tellwidth = true, tellheight = false, labelrotation = -1.5707963267948966, label = "", flipaxis = true) - use kwargs... of AlgebraOfGraphics.colorbar!
Return Value: Figure displaying the ERP plot.
This page was generated using Literate.jl.