Design matrix
Design matrix plot is a visualization type used to inspect the structure of predictors in EEG regression analysis. It fully represents the trials and predictors dimensions using a colored grid (heatmap). Each row corresponds to a trial, and each column to a predictor, with color intensity reflecting the predictor’s value.
Unlike ERP or butterfly plots that focus on time and channel dimensions, the design matrix plot focuses on the underlying experimental design. It gives a compact, at-a-glance overview of how predictors vary across trials 🧩.
Options like sort_data and standardize_data enhance interpretability by reorganizing trials or normalizing predictor scales. This type of plot is essential for checking data integrity before model fitting.
Setup
Package loading
using Unfold
using UnfoldMakie
using DataFrames
using CairoMakie
Data
uf = UnfoldMakie.example_data("UnfoldLinearModel");Plot Design Matrices
The following code will result in the default configuration.
plot_designmatrix(designmatrix(uf))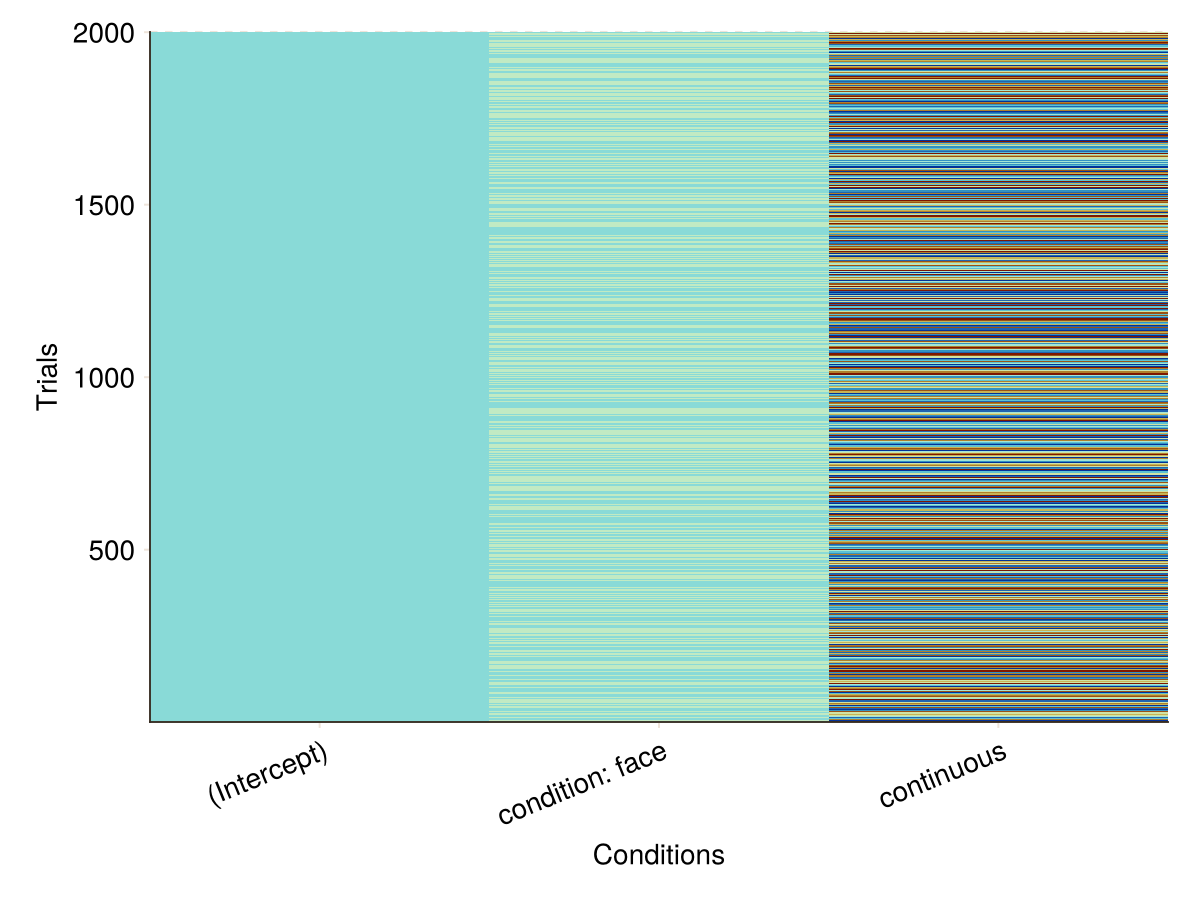
To make the design matrix easier to read, you may want to sort it using sort_data.
plot_designmatrix(designmatrix(uf); sort_data = true)
Configurations for Design matrix plot
UnfoldMakie.plot_designmatrix — Function
plot_designmatrix!(f::Union{GridPosition, GridLayout, Figure}, data::Unfold.DesignMatrix; kwargs...)
plot_designmatrix(data::Unfold.DesignMatrix; kwargs...)
Plot a designmatrix.
Arguments
f::Union{GridPosition, GridLayout, Figure}
Figure,GridLayout, orGridPositionto draw the plot.data::Unfold.DesignMatrix
Data for the plot visualization.
Keyword arguments (kwargs)
standardize_data::Bool = false
Indicates whether the data is standardized by pointwise division of the data with its sampled standard deviation.sort_data::Bool = false
Indicates whether the data is sorted. It usessortslices()of Base Julia.xticks::Num = nothing
Specifies the number of labels displayed on the x-axis.xticks = 0: No labels are displayed.xticks = 1: Only the first label is displayed.xticks = 2: The first and last labels are displayed.2 < xticks < number of labels: The labels are evenly distributed across the axis.xticks ≥ number of labels: All labels are displayed.
Shared plot configuration options
The shared plot options can be used as follows: type = (; key = value, ...)).
For example, plot_x(...; colorbar = (; vertical = true, label = "Test")).
Multiple defaults will be cycled until match.
Placing ; is important!
figure = NamedTuple() - use kwargs... of Makie.Figure
axis = (xlabel = "Conditions", ylabel = "Trials", xticklabelrotation = 0.39) - use kwargs... of Makie.Axis
layout = (show_legend = true, use_colorbar = true) - check this page
mapping = (x = (:time,), y = (:estimate, :yhat, :y)) - use any mapping from AlgebraOfGraphics
visual = (colormap = :roma,) - use kwargs... of Makie.heatmap
legend = (orientation = :vertical, tellwidth = true, tellheight = false, halign = :right, valign = :center) - use kwargs... of Makie.Legend
colorbar = (vertical = true, tellwidth = true, tellheight = false, labelrotation = -1.5707963267948966, flipaxis = true, label = "") - use kwargs... of Makie.Colorbar
Return Value: Figure displaying the Design matrix.
This page was generated using Literate.jl.