Parallel Coordinates
Parallel Coordinates Plot (PCP) is a visualization technique used to represent EEG activity across multiple channels.
- Trial dimension: Each line corresponds to a single trial. Alternatively, trials can be averaged to reduce visual complexity.
- Channel dimension: Each vertical axis is a channel. Although all channels can be shown, typically only a selected subset is visualized to avoid clutter.
- Condition and time dimensions: These can be encoded using the color or style of the lines to distinguish between experimental conditions or time windows.
- Voltage (EEG amplitude): Represented along the y-axis of each vertical axis. The scale can either be fixed across all channels or adjusted per channel, depending on the analysis goal.
Setup
Package loading
using Unfold
using UnfoldMakie
using DataFrames
using CairoMakie
Data generation
r1, positions = UnfoldMakie.example_data();
r2 = deepcopy(r1)
r2.coefname .= "B" # create a second category
r2.estimate .+= rand(length(r2.estimate)) * 0.1
results_plot = vcat(r1, r2);
Plot PCPs
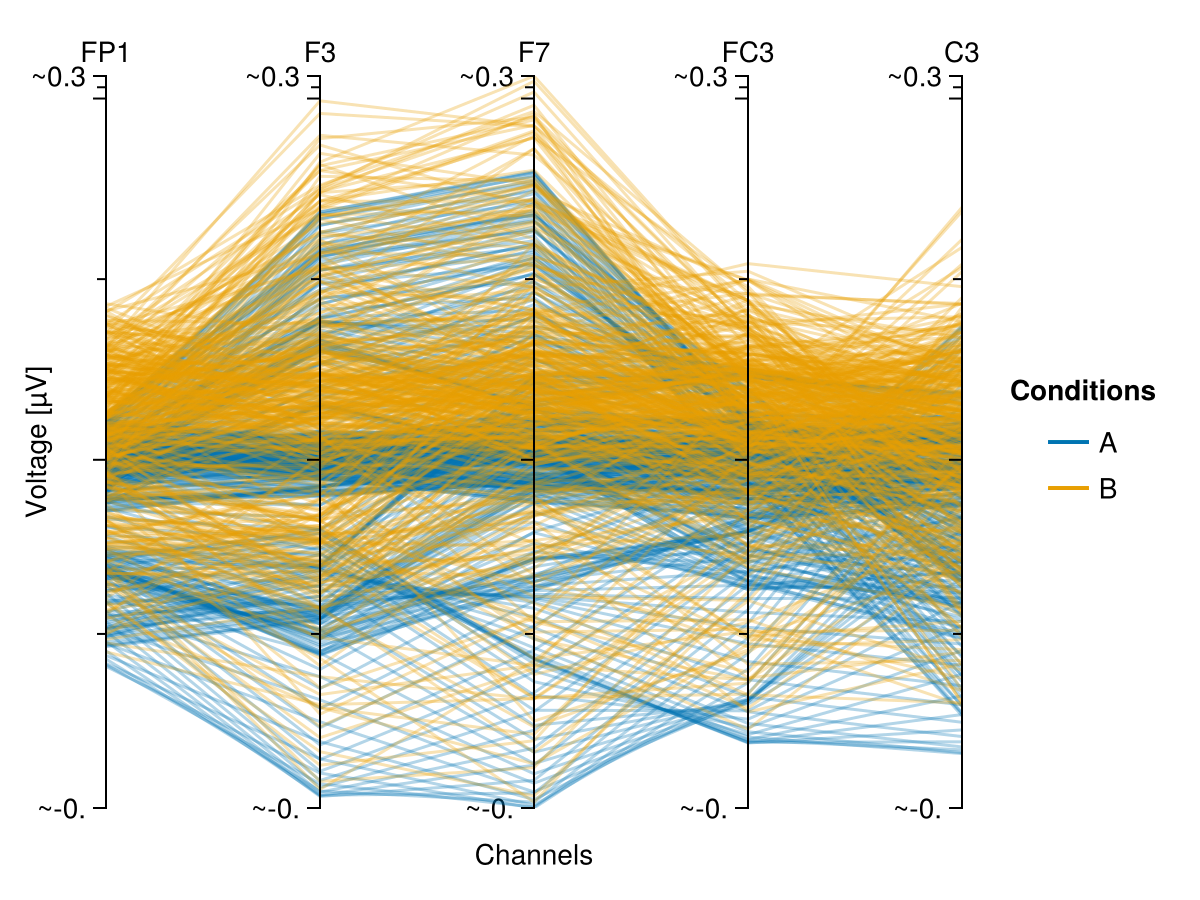
plot_parallelcoordinates(
    subset(results_plot, :channel => x -> x .<= 5);
    mapping = (; color = :coefname),
    ax_labels = ["FP1", "F3", "F7", "FC3", "C3"],
)
Additional features
Normalization
On the first image, there is no normalization and the extremes of all axes are the same and equal to the max and min values across all chanells. On the second image, there is a minmax normalization, so each axis has its own extremes based on the min and max of the data.
Typically, parallel plots are normalized per axis. Whether this makes sense for estimating channel x, we do not know.
begin
    f = Figure()
    plot_parallelcoordinates(
        f[1, 1],
        ax_labels = ["FP1", "F3", "F7", "FC3", "C3", "T7", "CP3", "P3", "P7", "O1"],
        subset(results_plot, :channel => x -> x .< 10);
        mapping = (; color = :coefname),
        axis = (; xlabel = "", title = "normalize = nothing"),
    )
    plot_parallelcoordinates(
        f[2, 1],
        ax_labels = ["FP1", "F3", "F7", "FC3", "C3", "T7", "CP3", "P3", "P7", "O1"],
        subset(results_plot, :channel => x -> x .< 10);
        mapping = (; color = :coefname),
        normalize = :minmax,
        axis = (; title = "normalize = :minmax"),
    )
    f
end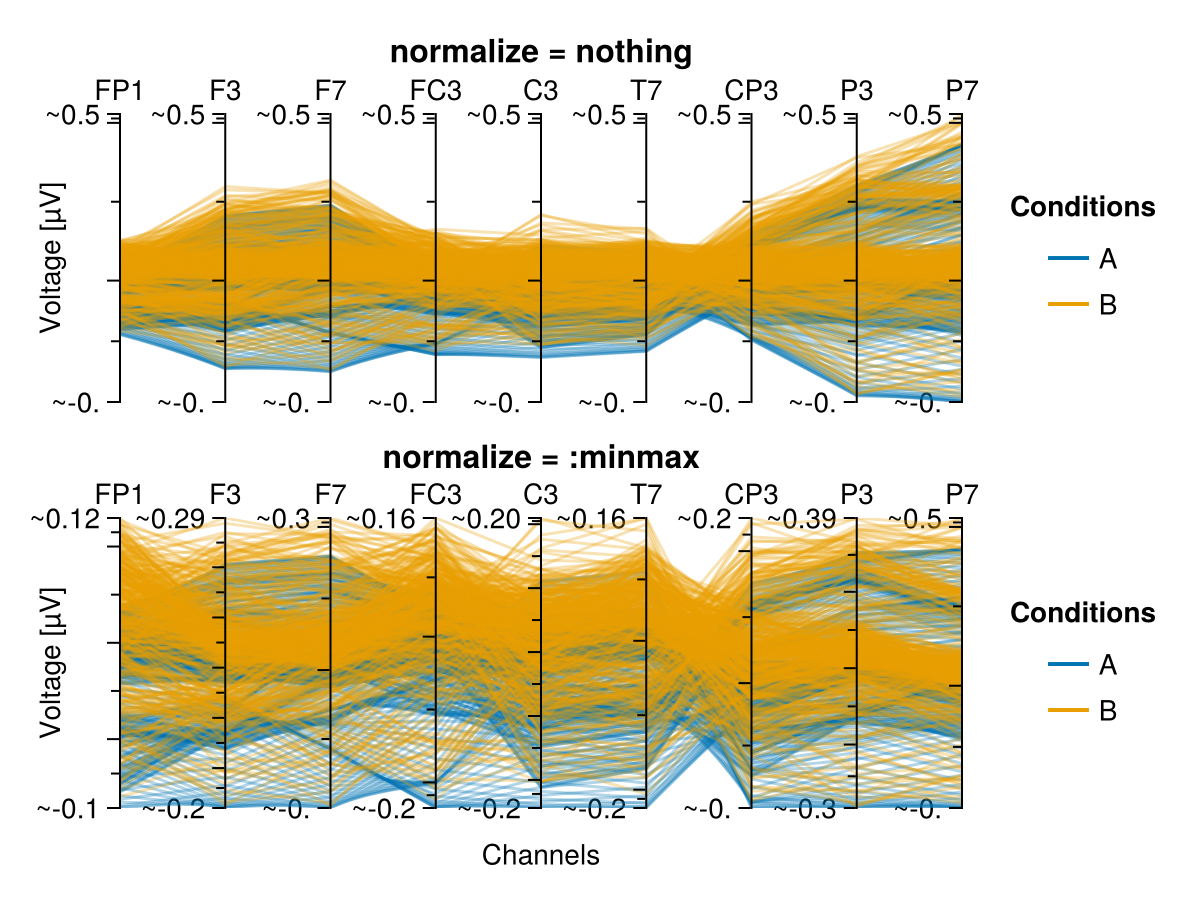
Color schemes
Use only categorical with high contrast between adjacent colors. More: change colormap.
begin
    f = Figure()
    plot_parallelcoordinates(
        f[1, 1],
        ax_labels = ["Fz", "Cz", "O1", "O2", "Pz"],
        subset(results_plot, :channel => x -> x .<= 5);
        mapping = (; color = :coefname),
        visual = (; colormap = :tab10),
        axis = (; xlabel = "", title = "colormap = tab10"),
    )
    plot_parallelcoordinates(
        f[2, 1],
        ax_labels = ["Fz", "Cz", "O1", "O2", "Pz"],
        subset(results_plot, :channel => x -> x .<= 5);
        mapping = (; color = :coefname),
        visual = (; colormap = :Accent_3),
        axis = (; title = "colormap = Accent_3"),
    )
    f
end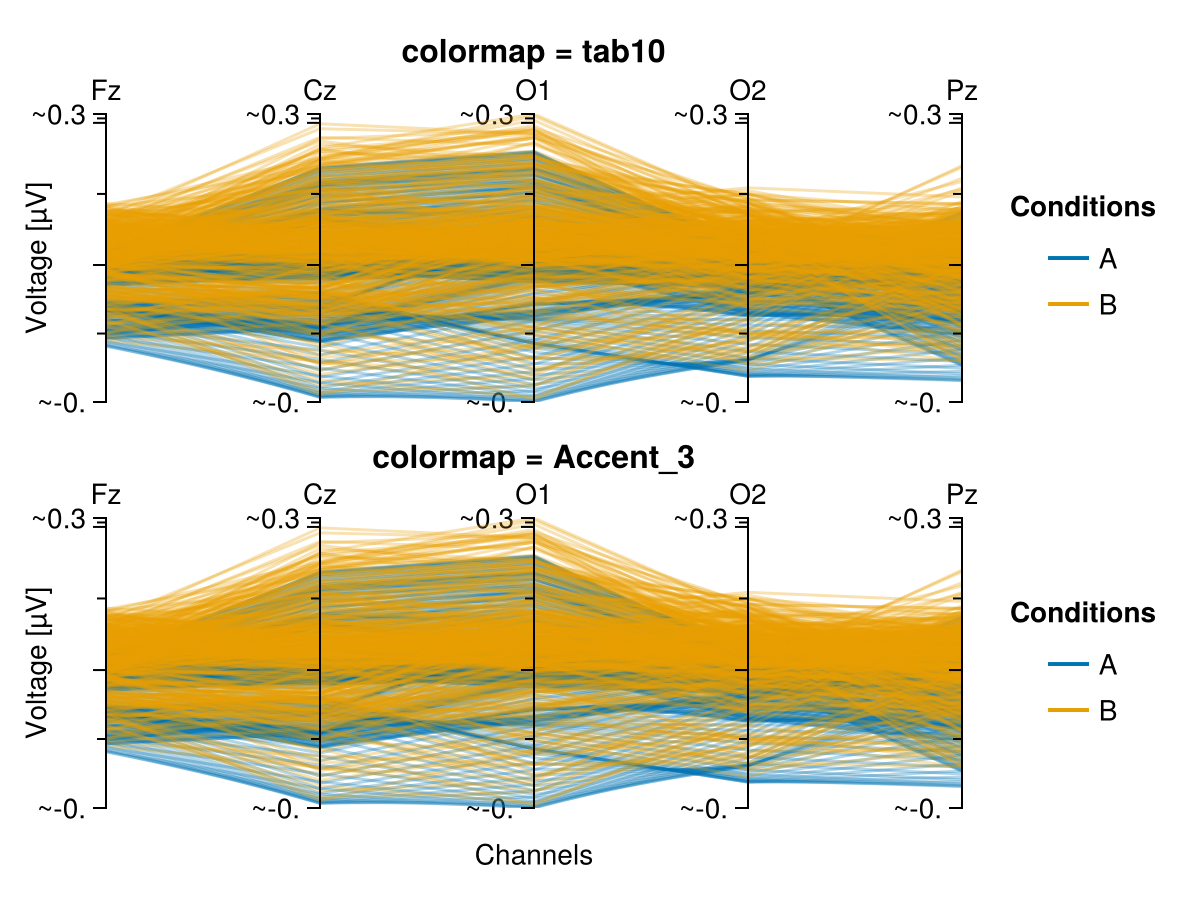
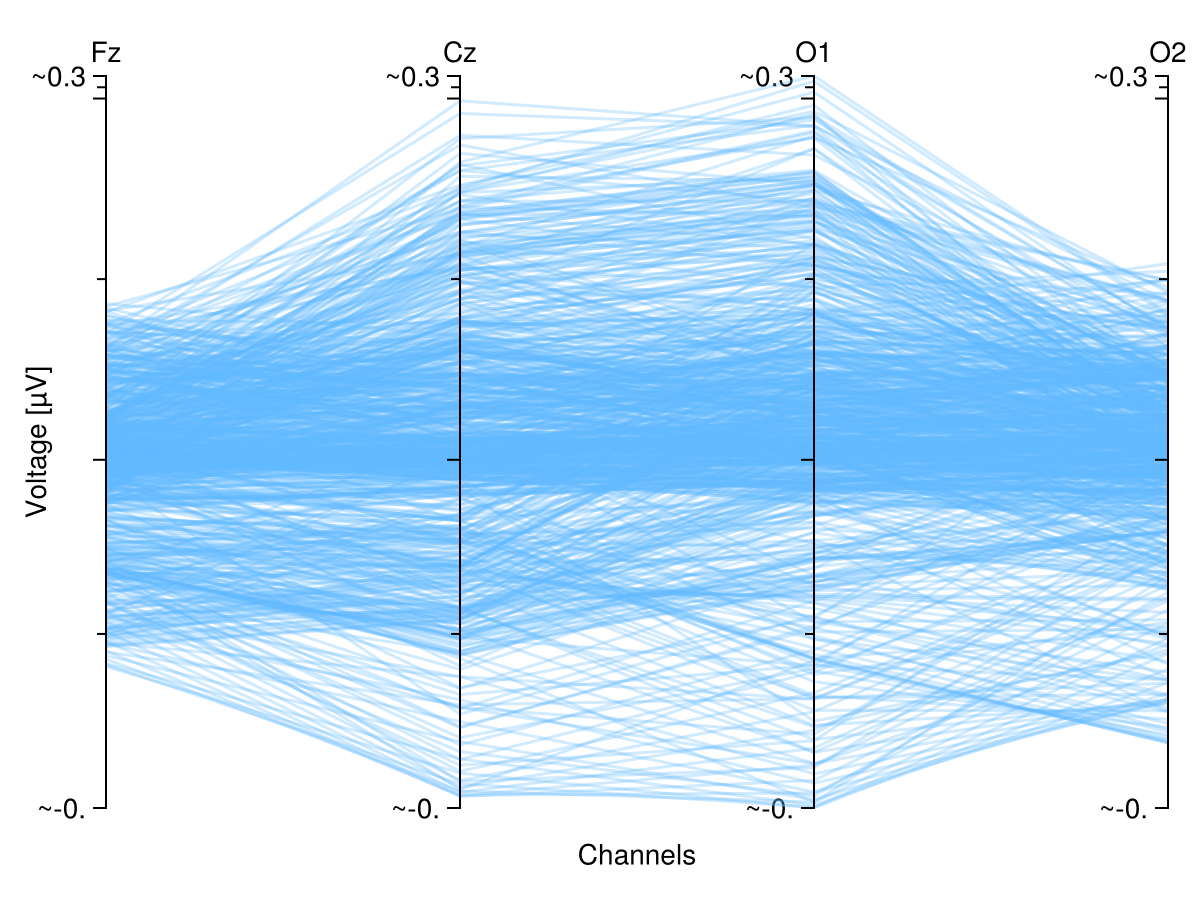
Labels
Use ax_labels to specify labels for the axes.
plot_parallelcoordinates(
    subset(results_plot, :channel => x -> x .< 5);
    visual = (; color = :steelblue1),
    ax_labels = ["Fz", "Cz", "O1", "O2"],
)
Tick labels
Specify tick labels on axis. There are four different options for the tick labels.
begin
    f = Figure(size = (500, 900))
    plot_parallelcoordinates(
        f[1, 1],
        subset(results_plot, :channel => x -> x .< 5, :time => x -> x .< 0);
        ax_labels = ["Fz", "Cz", "O1", "O2"],
        ax_ticklabels = :all,
        normalize = :minmax,
        visual = (; color = :burlywood1),
        axis = (;
            xlabel = "",
            ylabelpadding = 40,
            title = "ax_ticklabels = :all",
        ),
    ) # show all ticks on all axes
    plot_parallelcoordinates(
        f[2, 1],
        subset(results_plot, :channel => x -> x .< 5, :time => x -> x .< 0);
        ax_labels = ["Fz", "Cz", "O1", "O2"],
        ax_ticklabels = :left,
        normalize = :minmax,
        visual = (; color = :cyan3),
        axis = (;
            xlabel = "",
            ylabelpadding = 40,
            title = "ax_ticklabels = :left",
        ),
    ) # show all ticks on the left axis, but only extremities on others
    plot_parallelcoordinates(
        f[3, 1],
        subset(results_plot, :channel => x -> x .< 5, :time => x -> x .< 0);
        ax_labels = ["Fz", "Cz", "O1", "O2"],
        ax_ticklabels = :outmost,
        normalize = :minmax,
        visual = (; color = :burlywood1),
        axis = (;
            xlabel = "",
            ylabelpadding = 40,
            title = "ax_ticklabels = :outmost",
        ),
    ) # show ticks on extremities of all axes

    plot_parallelcoordinates(
        f[4, 1],
        subset(results_plot, :channel => x -> x .< 5, :time => x -> x .< 0);
        ax_labels = ["Fz", "Cz", "O1", "O2"],
        ax_ticklabels = :none,
        normalize = :minmax,
        visual = (; color = :cyan3),
        axis = (; ylabelpadding = 40, title = "ax_ticklabels = :none"),
    ) #  disable all ticks
    f
end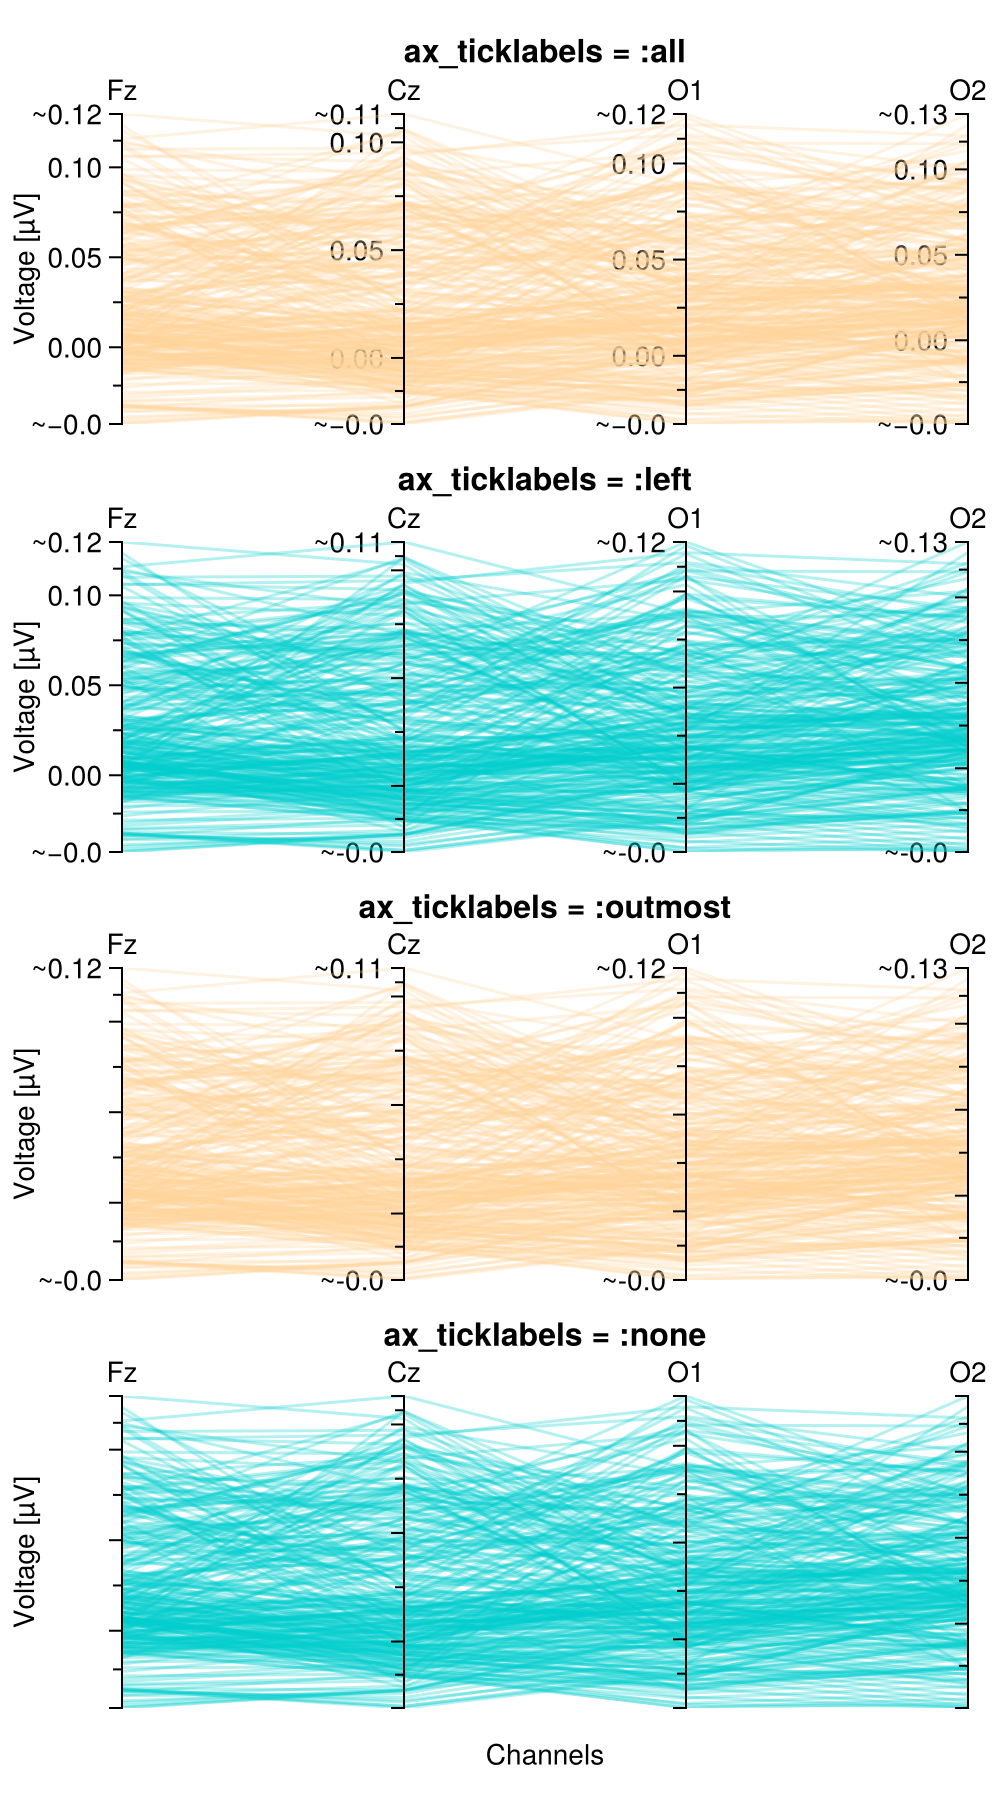
Bending the parallel plot
Bending the linescan be helpful to make them more visible.
begin
    f = Figure()
    plot_parallelcoordinates(
        f[1, 1],
        ax_labels = ["FP1", "F3", "F7", "FC3", "C3", "T7", "CP3", "P3", "P7", "O1"],
        subset(results_plot, :channel => x -> x .< 10),
        visual = (; color = :plum),
        axis = (; title = "bend = false", xlabel = ""),
    )
    plot_parallelcoordinates(
        f[2, 1],
        ax_labels = ["FP1", "F3", "F7", "FC3", "C3", "T7", "CP3", "P3", "P7", "O1"],
        subset(results_plot, :channel => x -> x .< 10),
        bend = true, # here
        visual = (; color = :plum),
        axis = (; title = "bend = true"),
    )
    f
end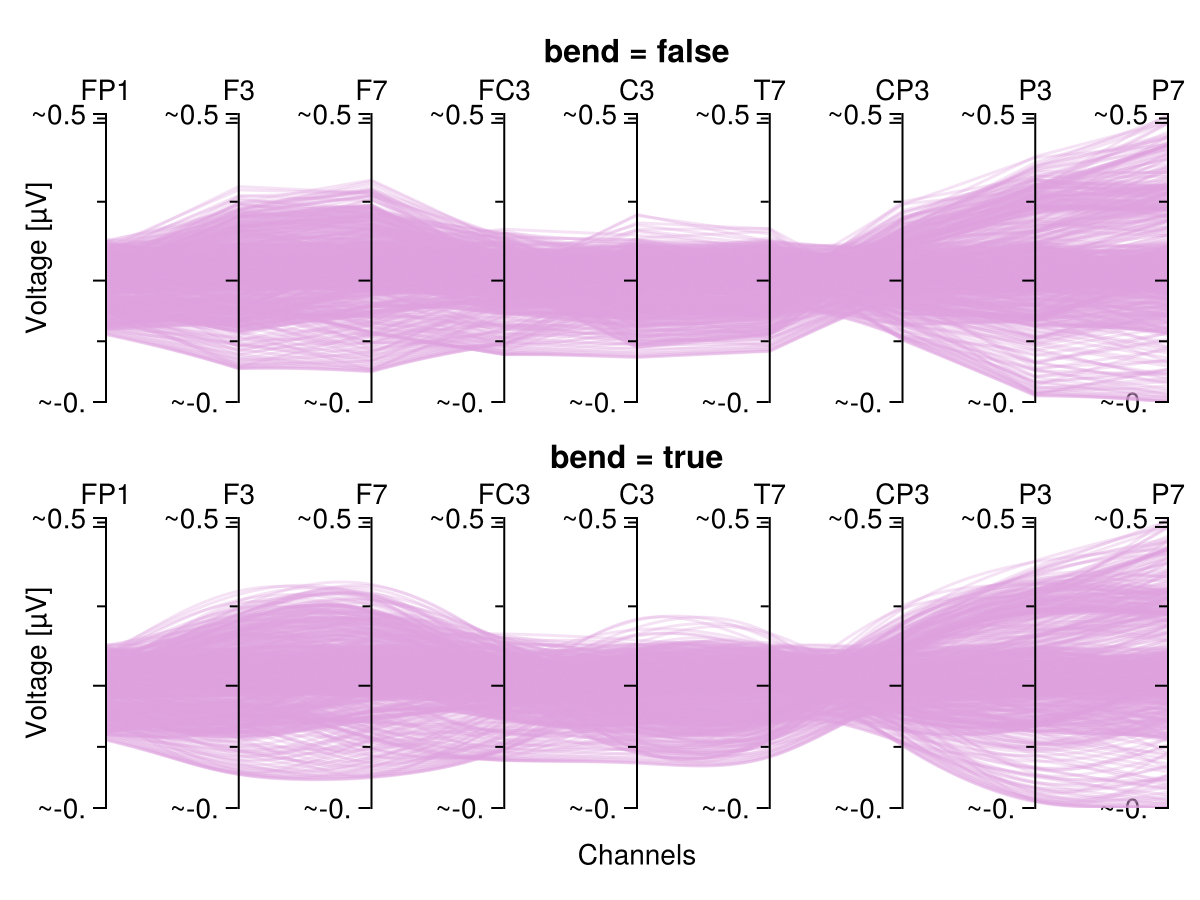
Transparancy
uf_5chan = UnfoldMakie.example_data("UnfoldLinearModelMultiChannel")

begin
    f = Figure()
    plot_parallelcoordinates(
        f[1, 1],
        uf_5chan;
        mapping = (; color = :coefname),
        ax_labels = ["FP1", "F3", "F7", "FC3", "C3"],
        visual = (; alpha = 0.1),
        axis = (;
            title = "alpha = 0.1",
            xlabel = "",
            ylabelpadding = 20,
        ),
    )
    plot_parallelcoordinates(
        f[2, 1],
        uf_5chan,
        mapping = (; color = :coefname),
        ax_labels = ["FP1", "F3", "F7", "FC3", "C3"],
        visual = (; alpha = 0.9),
        axis = (; title = "alpha = 0.9", ylabelpadding = 20),
    )
    f
end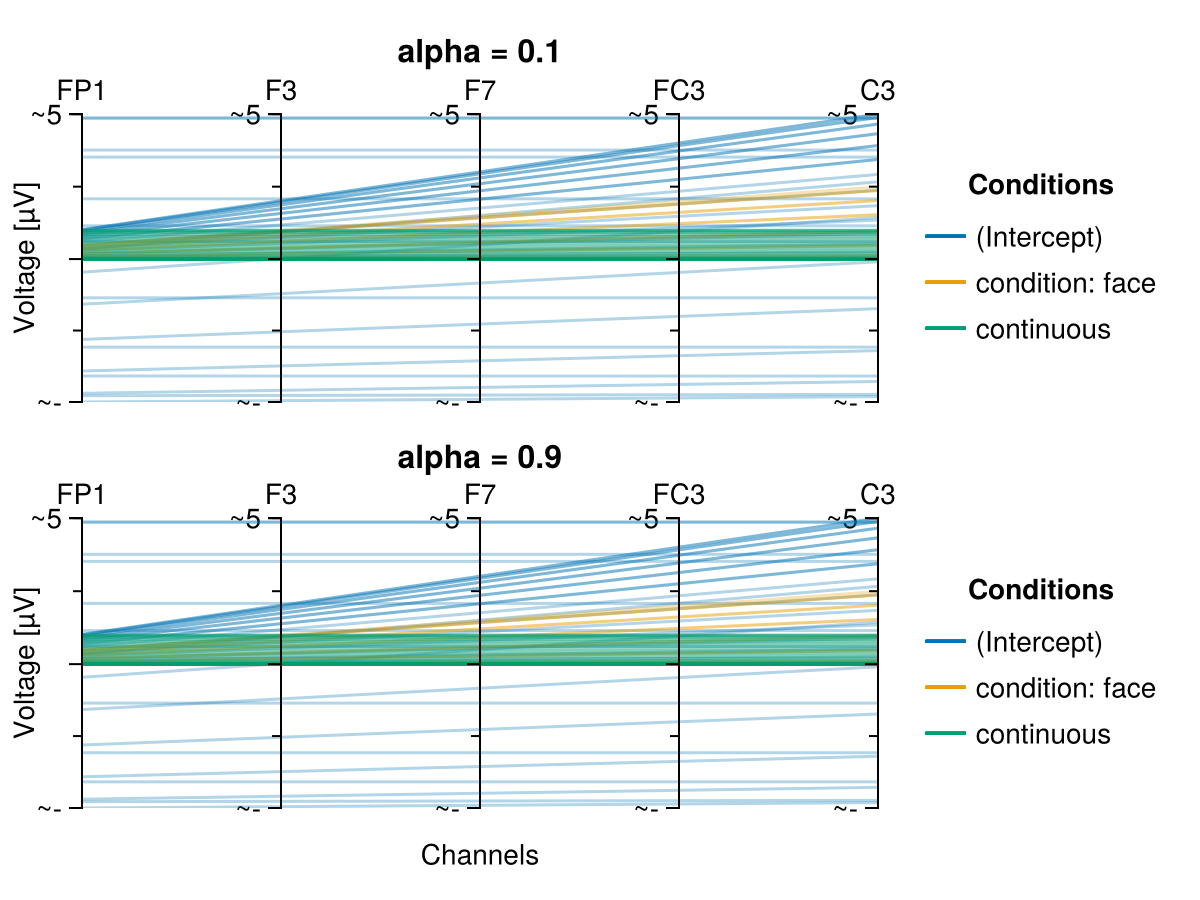
Configurations of Parallel coordinates plot
UnfoldMakie.plot_parallelcoordinates — Function
plot_parallelcoordinates(data::Union{DataFrame, AbstractMatrix}; kwargs...)
plot_parallelcoordinates!(f::Union{GridPosition, GridLayout, Figure}, data::Union{DataFrame, AbstractMatrix}; kwargs)
Plot a PCP (parallel coordinates plot).
Dimensions: conditions, channels, time, trials.
Arguments:
f::Union{GridPosition, GridLayout, Figure}Figure,GridLayout, orGridPositionto draw the plot.data::Union{DataFrame, AbstractMatrix}
Data for the plot visualization.
Keyword arguments (kwargs)
normalize::Symbol = nothing
If:minmax, normalize each axis to their respective min-max range.ax_labels::Vector{String} = nothing
Specify axis labels.
Should be a vector of labels with length equal to the number of uniquemapping.xvalues.
Example:ax_labels = ["Fz", "Cz", "O1", "O2"].ax_ticklabels::Symbol = :outmost
Specify tick labels on axis.:all- show all labels on all axes.:left- show all labels on the left axis, but only min and max on others.:outmost- show labels on min and max of all other axes.:none- remove all labels.
bend::Bool = false
Change straight lines between the axes to curved ("bent") lines using spline interpolation.
Note: While this makes the plot look cool, it is not generally recommended to bent the lines, as interpretation suffers, and the resulting visualizations can be potentially missleading.visual.alpha::Number = 0.5
Change of line transparency.
Defining the axes
mapping.x = :channel, mapping.y = :estimate.
Overwrite what should be on the x and the y axes.mapping.color = :colorcolumn
Split conditions by color. The default color is:black.
Shared plot configuration options
The shared plot options can be used as follows: type = (; key = value, ...)).
For example, plot_x(...; colorbar = (; vertical = true, label = "Test")).
Multiple defaults will be cycled until match.
Placing ; is important!
figure = NamedTuple() - use kwargs... of Makie.Figure
axis = (xlabel = "Channels", ylabel = "Voltage [µV]", title = "", xlabelpadding = 14, ylabelpadding = 26) - use kwargs... of Makie.Axis
layout = (show_legend = true, use_colorbar = true) - check this page
mapping = (x = :channel, y = (:estimate, :yhat, :y)) - use any mapping from AlgebraOfGraphics
visual = (colormap = ColorTypes.RGBA{Float32}[RGBA(0.0, 0.44705883, 0.69803923, 1.0), RGBA(0.9019608, 0.62352943, 0.0, 1.0), RGBA(0.0, 0.61960787, 0.4509804, 1.0), RGBA(0.8, 0.4745098, 0.654902, 1.0), RGBA(0.3372549, 0.7058824, 0.9137255, 1.0), RGBA(0.8352941, 0.36862746, 0.0, 1.0), RGBA(0.9411765, 0.89411765, 0.25882354, 1.0)], color = :black, alpha = 0.3) - use kwargs... of Makie.lines
legend = (orientation = :vertical, tellwidth = true, tellheight = false, halign = :right, valign = :center, title = "Conditions", merge = true, framevisible = false) - use kwargs... of Makie.Legend
colorbar = (vertical = true, tellwidth = true, tellheight = false, labelrotation = -1.5707963267948966) - use kwargs... of Makie.Colorbar
Return Value: Figure displaying the Parallel coordinates plot.
This page was generated using Literate.jl.