ERP image
ERP image is a plot type for visualizing EEG activity for all trials. It can fully represent time and trial dimensions using a heatmap. Y-axis represents all trials, x-axis represents time, while color represents voltage. The ERP image can also be sorted by specific experimental variables, which helps to reveal important correlations.
Setup
Package loading
using Unfold
using UnfoldMakie
using CairoMakie
using UnfoldSim
using Statistics
Data input
dat, evts = UnfoldSim.predef_eeg(; noiselevel = 10, return_epoched = true)([7.12587424046967 -14.641640521225252 … 8.770271520309837 4.669510193385215; -0.9563957036781133 -12.68032463971624 … 5.23123205493583 -3.3335410378671755; … ; -4.338685265141942 -15.924754085507267 … -1.698015968469315 -14.506666772402694; -2.716035846137998 -10.050219653832466 … 2.624995200920666 -17.11543056266384], 2000×3 DataFrame
Row │ continuous condition latency
│ Float64 String Int64
──────┼────────────────────────────────
1 │ 2.77778 car 62
2 │ -5.0 face 132
3 │ -1.66667 car 196
4 │ -5.0 car 249
5 │ 5.0 car 303
6 │ -0.555556 car 366
7 │ -2.77778 car 432
8 │ -2.77778 face 483
⋮ │ ⋮ ⋮ ⋮
1994 │ 1.66667 car 119798
1995 │ 2.77778 car 119856
1996 │ -5.0 car 119925
1997 │ 3.88889 car 119978
1998 │ -5.0 face 120030
1999 │ -0.555556 face 120096
2000 │ -2.77778 car 120154
1985 rows omitted)Plot ERP image
plot_erpimage(dat, axis = (; xlabel = "Time [s]"))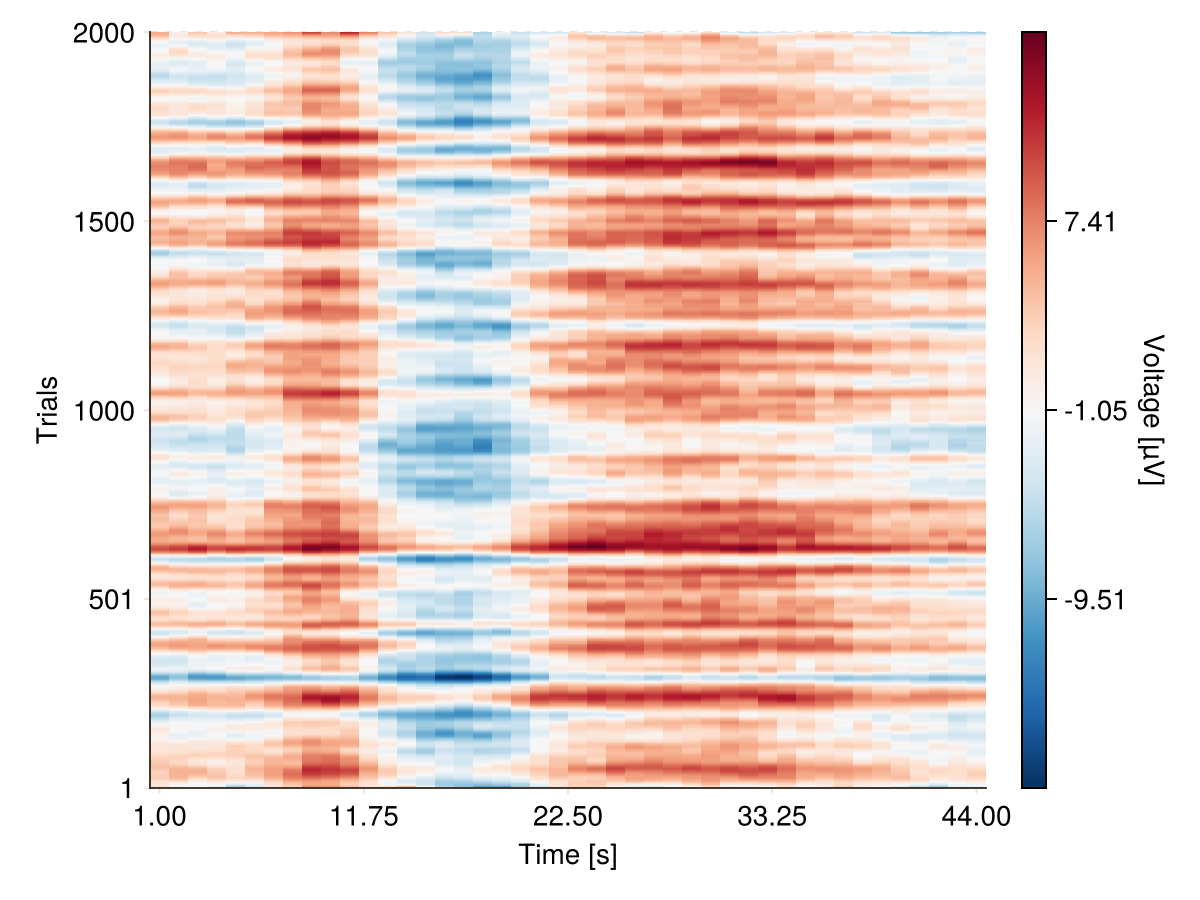
Sorted ERP image
Generate the data and specify the necessary sorting parameter.
sortvalues::Vector{Int64} = falseParameter over which plot will be sorted. Usingsortperm()of Base Julia.sortperm()computes a permutation of the array's indices that puts the array in sorted order.
dat_e, evts, times = UnfoldMakie.example_data("sort_data")
dat_norm = dat_e[:, :] .- mean(dat_e, dims = 2) # normalisation
plot_erpimage(times, dat_norm; sortvalues = evts.Δlatency, axis = (; xlabel = "Time [s]"))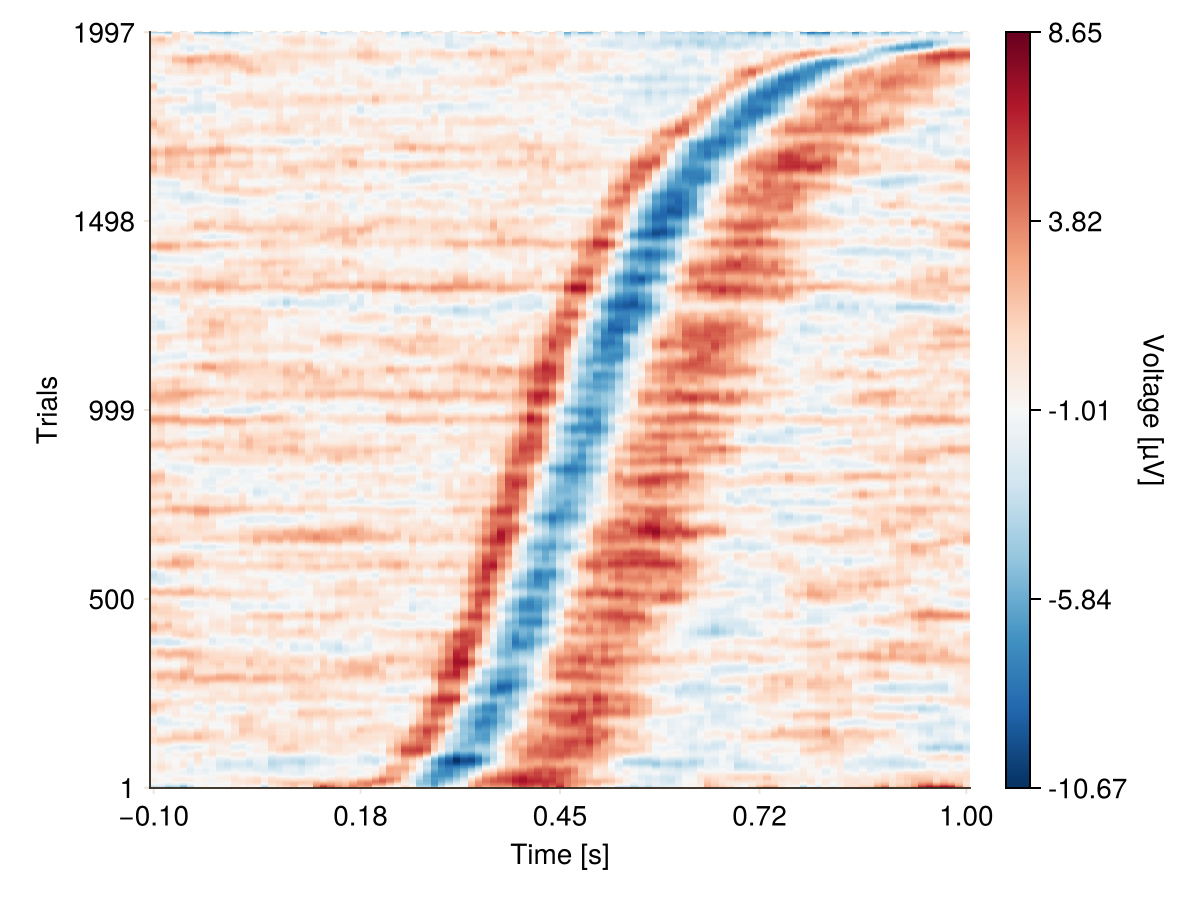
To see the effect of sorting and normalization, also check this figure.
f = Figure()
plot_erpimage!(f[1, 1], times, dat_e; axis = (; xlabel = ""), colorbar = (; label = ""))
plot_erpimage!(
    f[2, 1],
    times,
    dat_e;
    sortvalues = evts.Δlatency,
    axis = (; xlabel = "Time [s]"),
    colorbar = (; label = ""),
)
plot_erpimage!(f[1, 2], times, dat_norm; axis = (; ylabel = "", xlabel = ""))
plot_erpimage!(
    f[2, 2],
    times,
    dat_norm;
    sortvalues = evts.Δlatency,
    axis = (; ylabel = "", xlabel = "Time [s]"),
)
f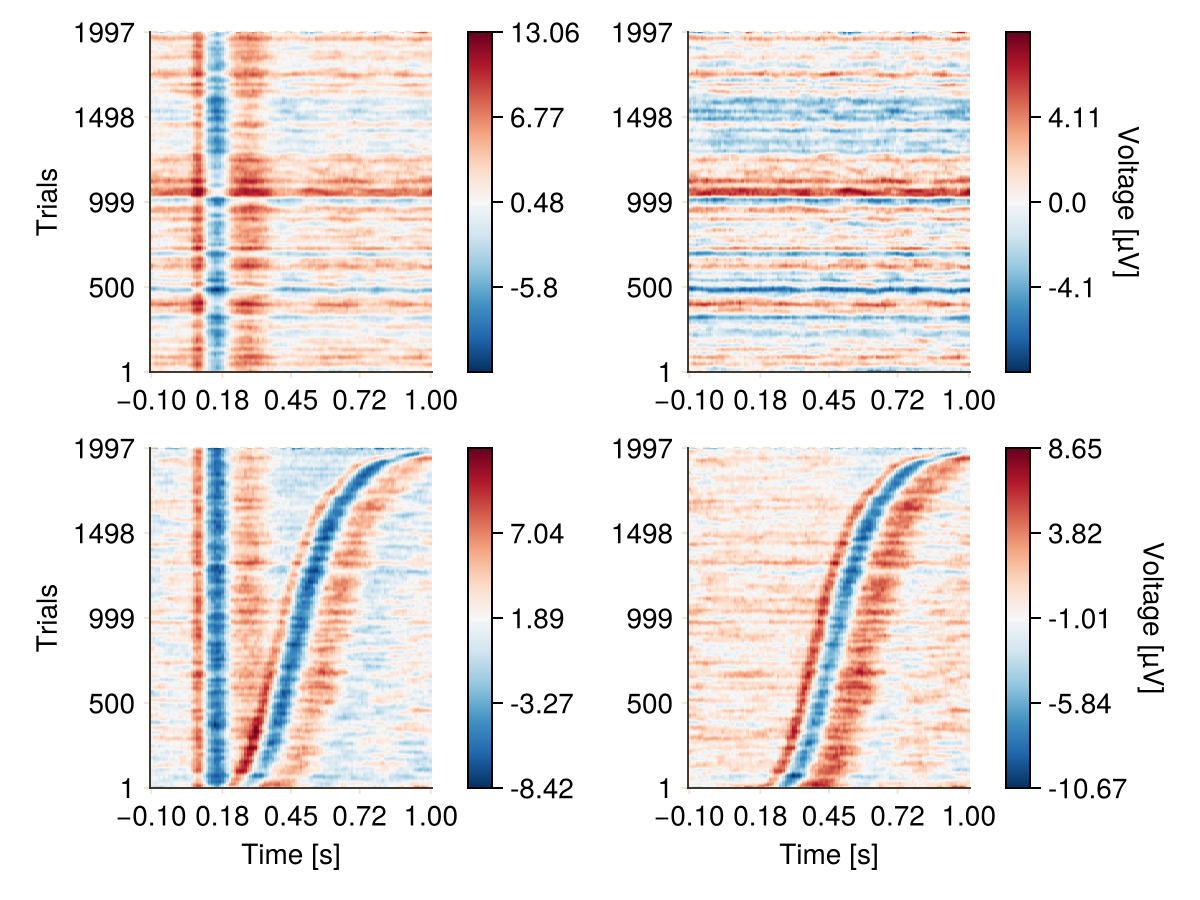
Additional features
Since ERP images use a Matrix as an input, the library does not need any informations about the mapping.
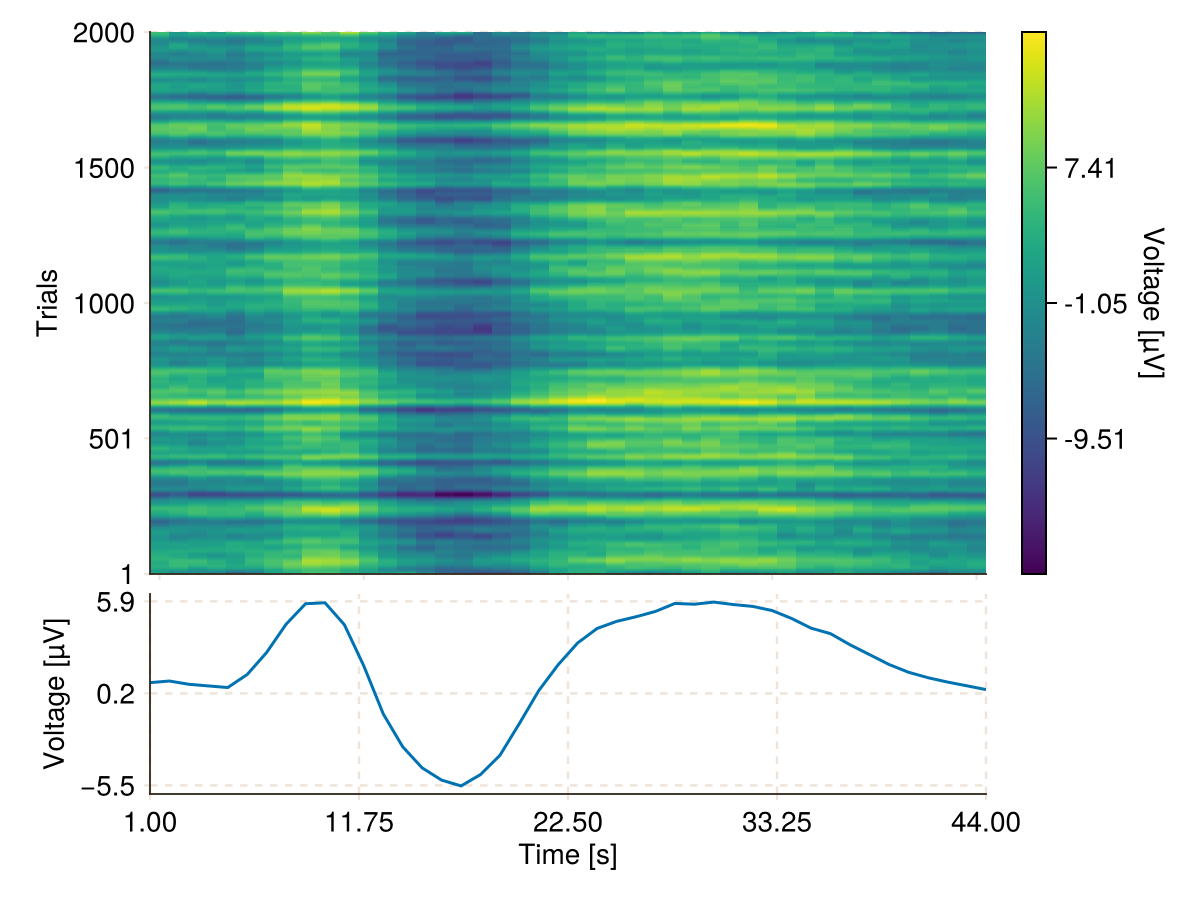
erpblur::Number = 10Number indicating how much blur is applied to the image. Gaussian blur of theImageFilteringmodule is used.meanplot::bool = falseIndicating whether the plot should add a line plot below the ERP image, showing the mean of the data.
Example of mean plot
plot_erpimage(
    dat;
    meanplot = true,
    colorbar = (; label = "Voltage [µV]",),
    visual = (; colormap = :viridis),
    meanplot_axis = (; xlabel = "Time [s]"),
)
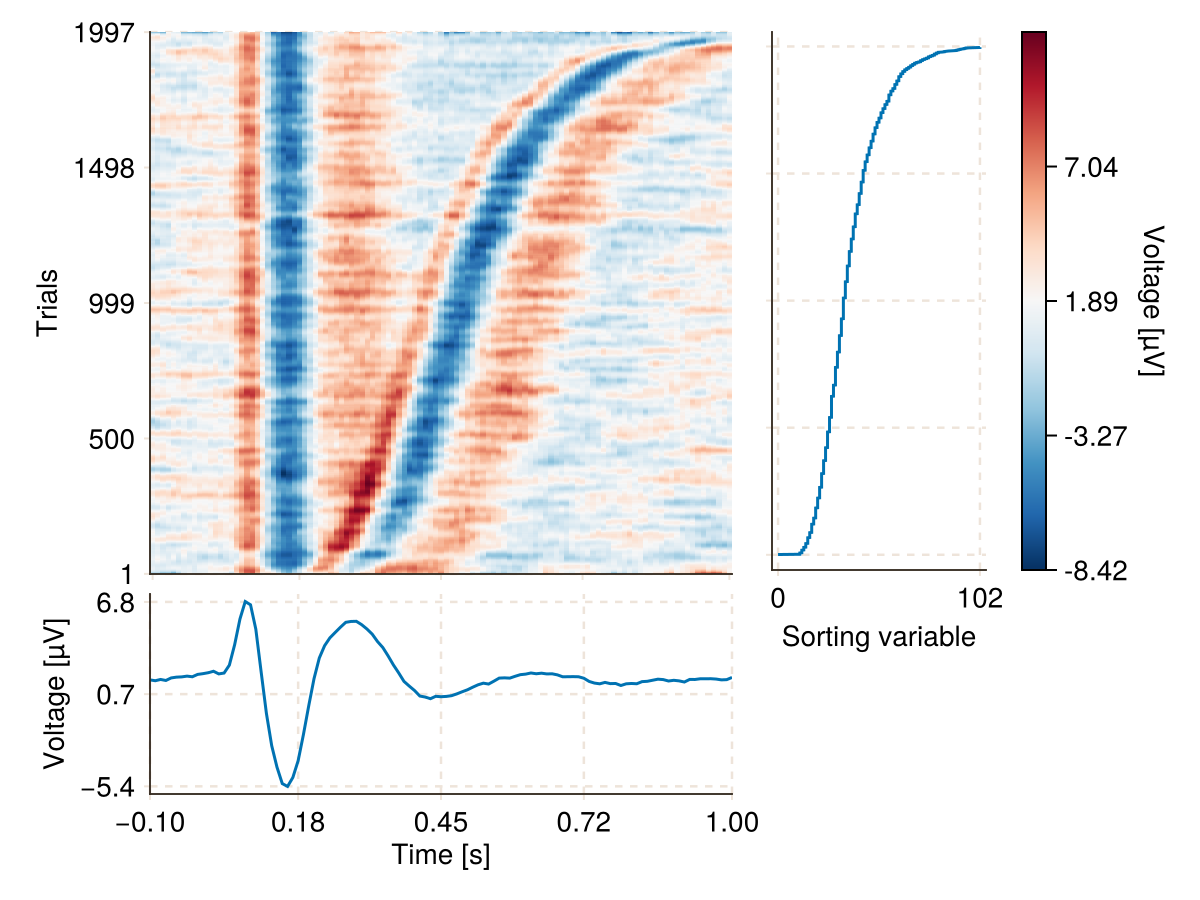
Example of mean plot and plot of sorted values
plot_erpimage(
    times,
    dat_e;
    sortvalues = evts.Δlatency,
    meanplot = true,
    show_sortval = true,
    meanplot_axis = (; xlabel = "Time [s]"),
)
Configurations for ERP image
UnfoldMakie.plot_erpimage — Function
plot_erpimage!(f::Union{GridPosition, GridLayout, Figure}, data::AbstractMatrix{Float64}; kwargs...)
plot_erpimage!(f::Union{GridPosition, GridLayout, Figure}, data::Observable{<:AbstractMatrix}; kwargs...)
plot_erpimage!(f::Union{GridPosition, GridLayout, Figure}, times::Observable{<:AbstractVector}, data::Observable{<:AbstractMatrix{<:Real}}; kwargs...)

plot_erpimage(times::AbstractVector, data::Union{<:Observable{Matrix{<:Real}}, Matrix{<:Real}}; kwargs...)
plot_erpimage(data::Matrix{Float64}; kwargs...)
Plot an ERP image.
Arguments:
f::Union{GridPosition, GridLayout, Figure}
Figure,GridLayout, orGridPositionto draw the plot.data::Union{DataFrame, Vector{Float32}}
Data for the plot visualization.
Keyword arguments (kwargs)
erpblur::Number = 10
Number indicating how much blur is applied to the image.
Gaussian blur of theImageFilteringmodule is used.
Non-Positive values deactivate the blur.sortvalues::Vector{Int64} = false
Parameter over which plot will be sorted. Usingsortperm()of Base Julia.
sortperm()computes a permutation of the array's indices that puts the array in sorted order.sortindex::Vector{Int64} = nothing
Sorting over index values.meanplot::bool = false
Add a line plot below the ERP image, showing the mean of the data.show_sortval::bool = false
Add a plot on the right from ERP image, showing the distribution of the sorting data.sortval_xlabel::String = "Sorting variable"
Ifshow_sortval = truecontrols xlabel.axis.ylabel::String = "Trials"
Ifsortvalues = truethe default text will change to "Sorted trials", but it could be changed to any values specified manually.meanplot_axis::NamedTuple = (;)
Here you can flexibly change configurations of meanplot.
To see all options just type?Axisin REPL.
Defaults: (height = 100, xlabel = "Time", xlabelpadding = 0, xautolimitmargin = (0, 0))sortplot_axis::NamedTuple = (;)
Here you can flexibly change configurations of meanplot.
To see all options just type?Axisin REPL.
Defaults: (ylabelvisible = true, yticklabelsvisible = false)
Shared plot configuration options
The shared plot options can be used as follows: type = (; key = value, ...)).
For example, plot_x(...; colorbar = (; vertical = true, label = "Test")).
Multiple defaults will be cycled until match.
Placing ; is important!
figure = NamedTuple() - use kwargs... of Makie.Figure
axis = (xlabel = "Time", ylabel = "Trials") - use kwargs... of Makie.Axis
layout = (show_legend = true, use_colorbar = true) - check this page
mapping = (x = (:time,), y = (:estimate, :yhat, :y)) - use any mapping from AlgebraOfGraphics
visual = (colormap = Makie.Reverse{String}("RdBu"),) - use kwargs... of Makie.heatmap
legend = (orientation = :vertical, tellwidth = true, tellheight = false, halign = :right, valign = :center) - use kwargs... of Makie.Legend
colorbar = (vertical = true, tellwidth = true, tellheight = false, labelrotation = -1.5707963267948966, label = "Voltage [µV]") - use kwargs... of Makie.Colorbar
Return Value: Figure displaying the ERP image.
This page was generated using Literate.jl.