ERP grid
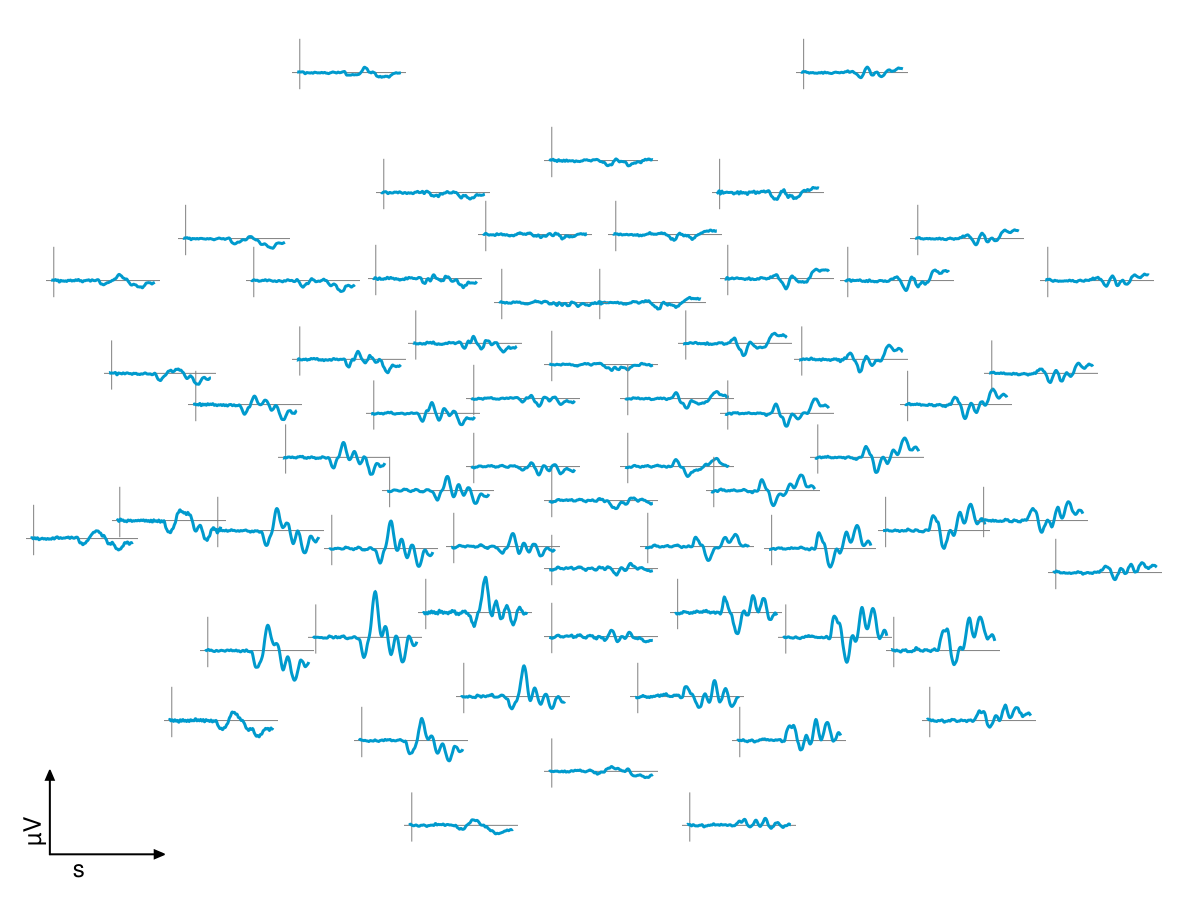
ERP grid is a plot type for visualisation of Event-related potentials. It can fully represent time, channel, and layout (channel locations) dimensions using lines. It can also partially represent condition dimensions. Lines are displayed on a grid. The location of each axis represents the location of the electrode. This plot type is not as popular because it is too cluttered.
Setup
Package loading
using Unfold
using UnfoldMakie
using CairoMakie
using UnfoldSim
using TopoPlots
Data
data, pos = TopoPlots.example_data()
data = data[:, :, 1]
channels_32, positions_32 = UnfoldMakie.example_montage("montage_32")
channels_64, positions_64 = UnfoldMakie.example_montage("montage_64")
(["Fp1", "AF7", "AF3", "F1", "F3", "F5", "F7", "FT7", "FC5", "FC3" … "CP4", "CP2", "P2", "P4", "P6", "P8", "P10", "PO8", "PO4", "O2"], Point{2, Float32}[[-92.0, -72.0], [-92.0, -54.0], [-74.0, -65.0], [-50.0, -68.0], [-60.0, -51.0], [-75.0, -41.0], [-92.0, -36.0], [-92.0, -18.0], [-72.0, -21.0], [-50.0, -28.0] … [50.0, -28.0], [32.0, -45.0], [50.0, -68.0], [60.0, -51.0], [75.0, -41.0], [92.0, -36.0], [115.0, -36.0], [92.0, -54.0], [74.0, -65.0], [92.0, -72.0]])Plot ERP grid
plot_erpgrid(
    data,
    pos;
    indicator_grid_axis = (;
        text_x_kwargs = (; text = "s"),
        text_y_kwargs = (; text = "µV"),
    ),
)
Adding labels
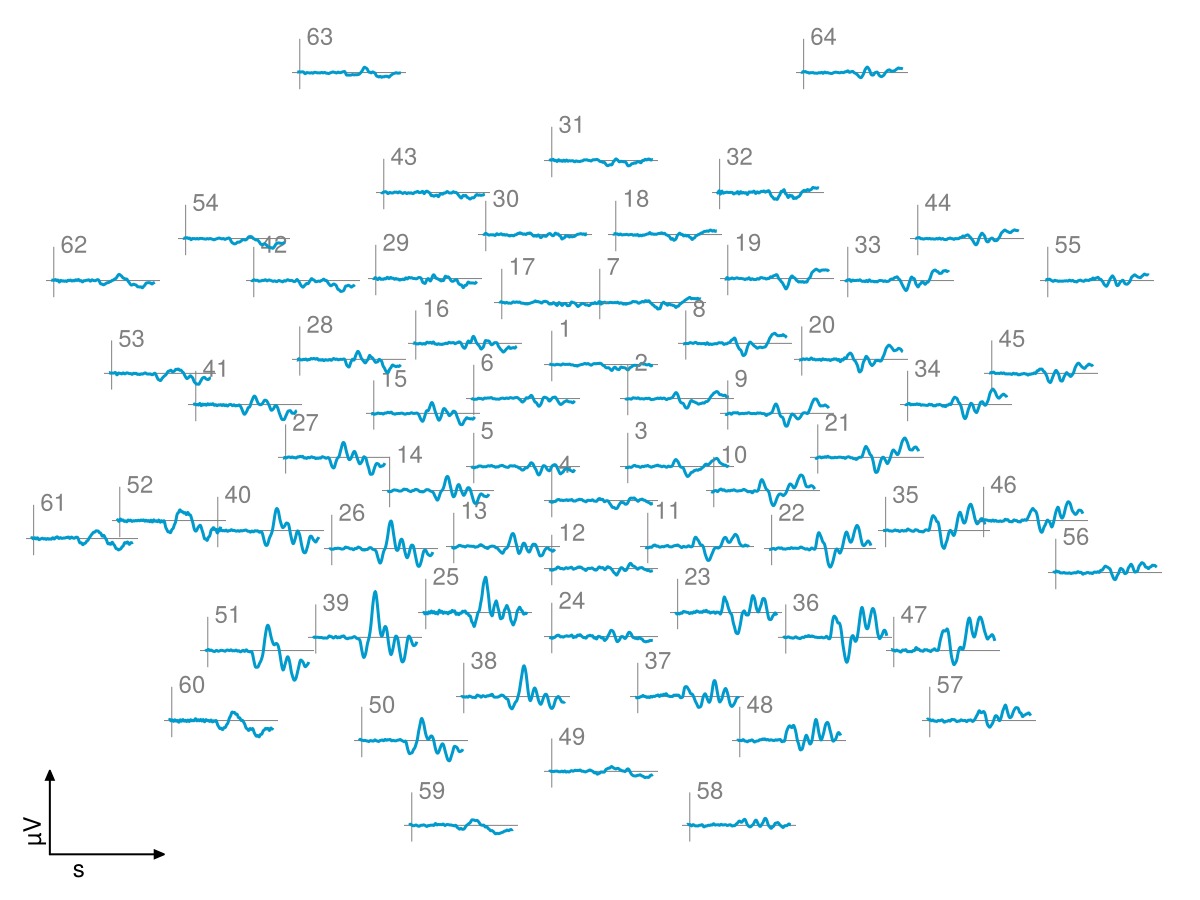
By default labels are just numbers.
plot_erpgrid(
    data,
    pos;
    drawlabels = true,
    indicator_grid_axis = (;
        text_x_kwargs = (; text = "s"),
        text_y_kwargs = (; text = "µV"),
    ),
)
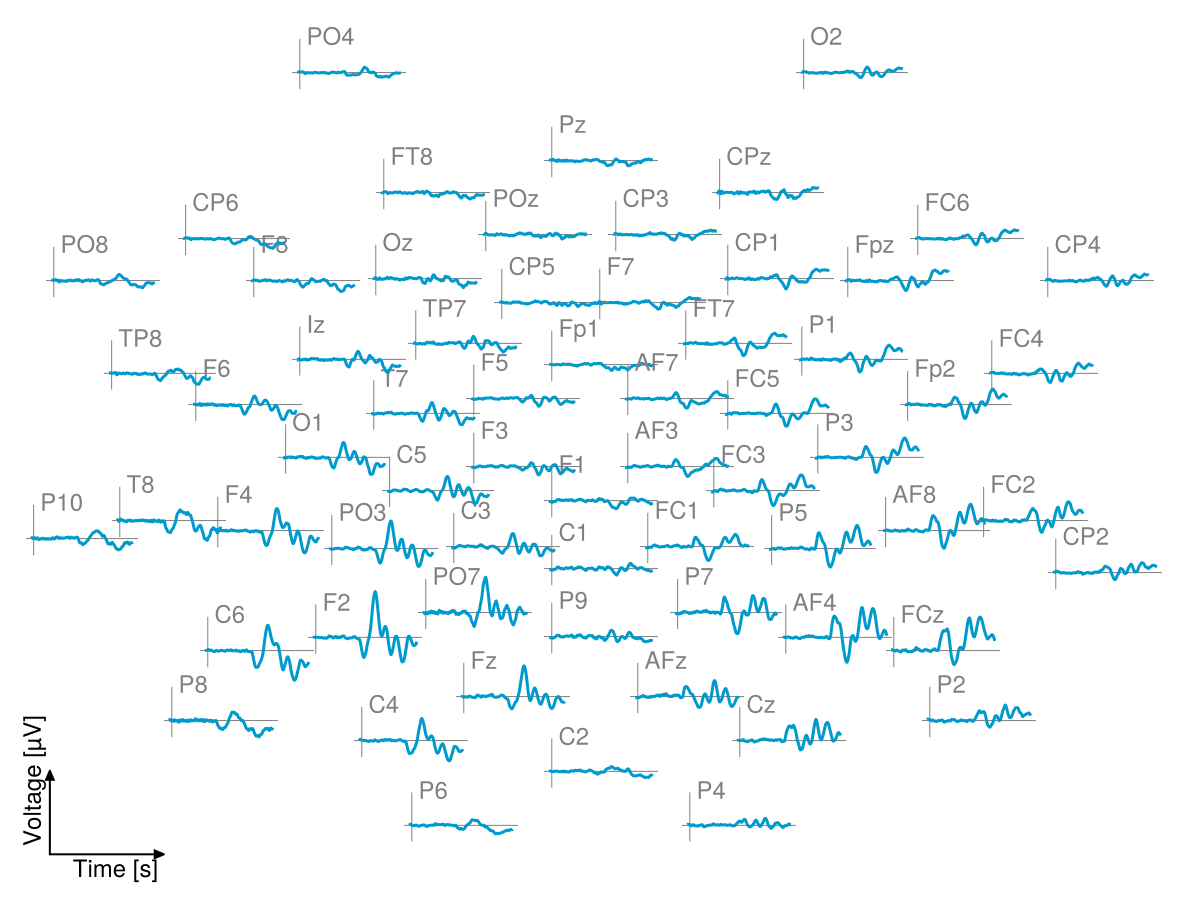
But you can also use predefined vector of channel labels.
plot_erpgrid(
    data,
    pos,
    channels_64;
    drawlabels = true,
    indicator_grid_axis = (; xlabel = "s", ylabel = "µV"),
)
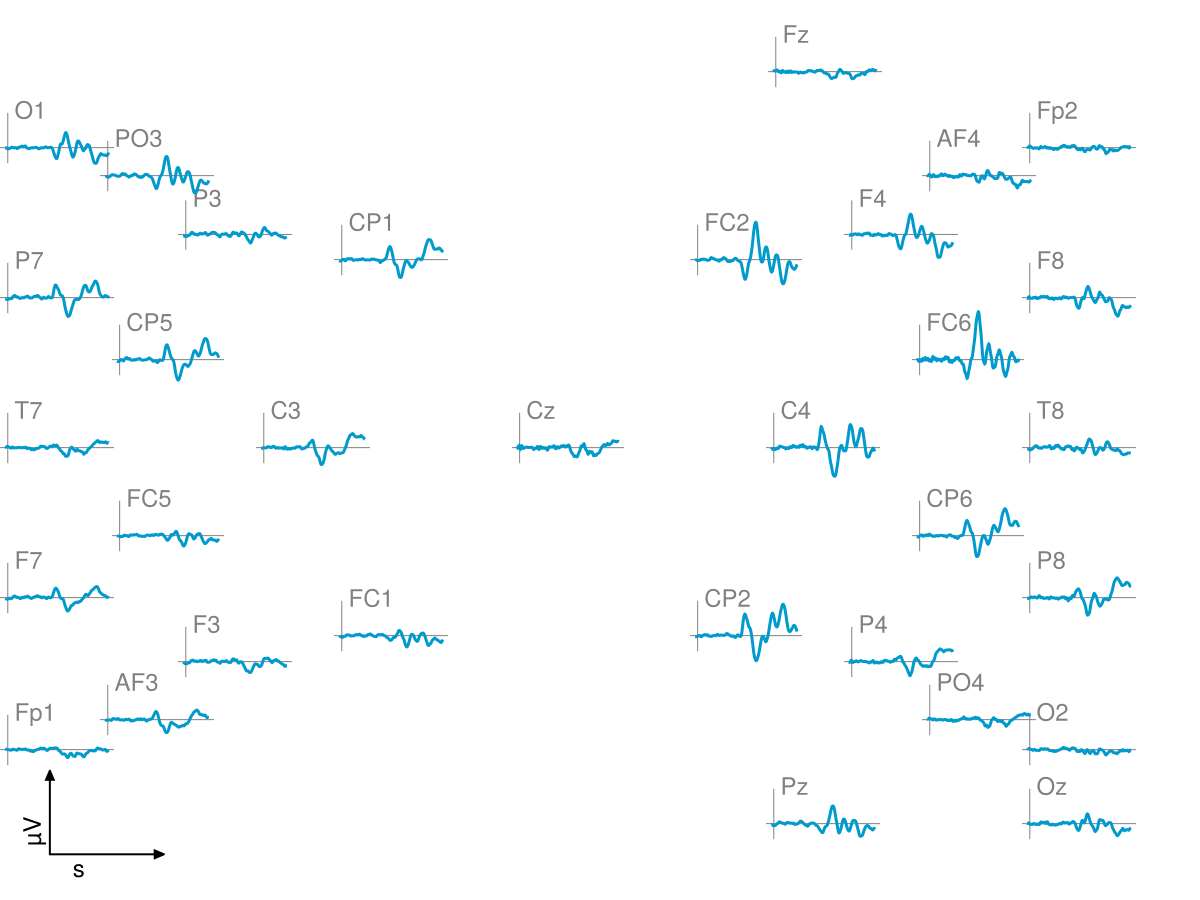
Customizing coordinates
You can adjust the coordinates of subplots to improve their alignment. One simple method is rounding the coordinates to specific intervals.
Example: Rounding the y-coordinate by 3 precision digits.
pos_new = [Point2(p[1], round(p[2], digits = 3)) for p in positions_32]
plot_erpgrid(
    data[1:32, :],
    pos_new,
    channels_32;
    drawlabels = true,
    indicator_grid_axis = (;
        text_x_kwargs = (; text = "s"),
        text_y_kwargs = (; text = "µV"),
    ),
)
To manually adjust the position of a specific subplot, modify its coordinates using Point() with arithmetic operations.
Example: Shifting the first subplot 0.1 units upward on the y-axis.
pos_new[31] = Point(pos_new[31][1] + 0.2, pos_new[31][2]) # P9
plot_erpgrid(
    data[1:32, :],
    pos_new,
    channels_32;
    drawlabels = true,
    indicator_grid_axis = (;
        text_x_kwargs = (; text = "s"),
        text_y_kwargs = (; text = "µV"),
    ),
)
Hint: If you need to generate simple montage coordinates and channel names check them out here
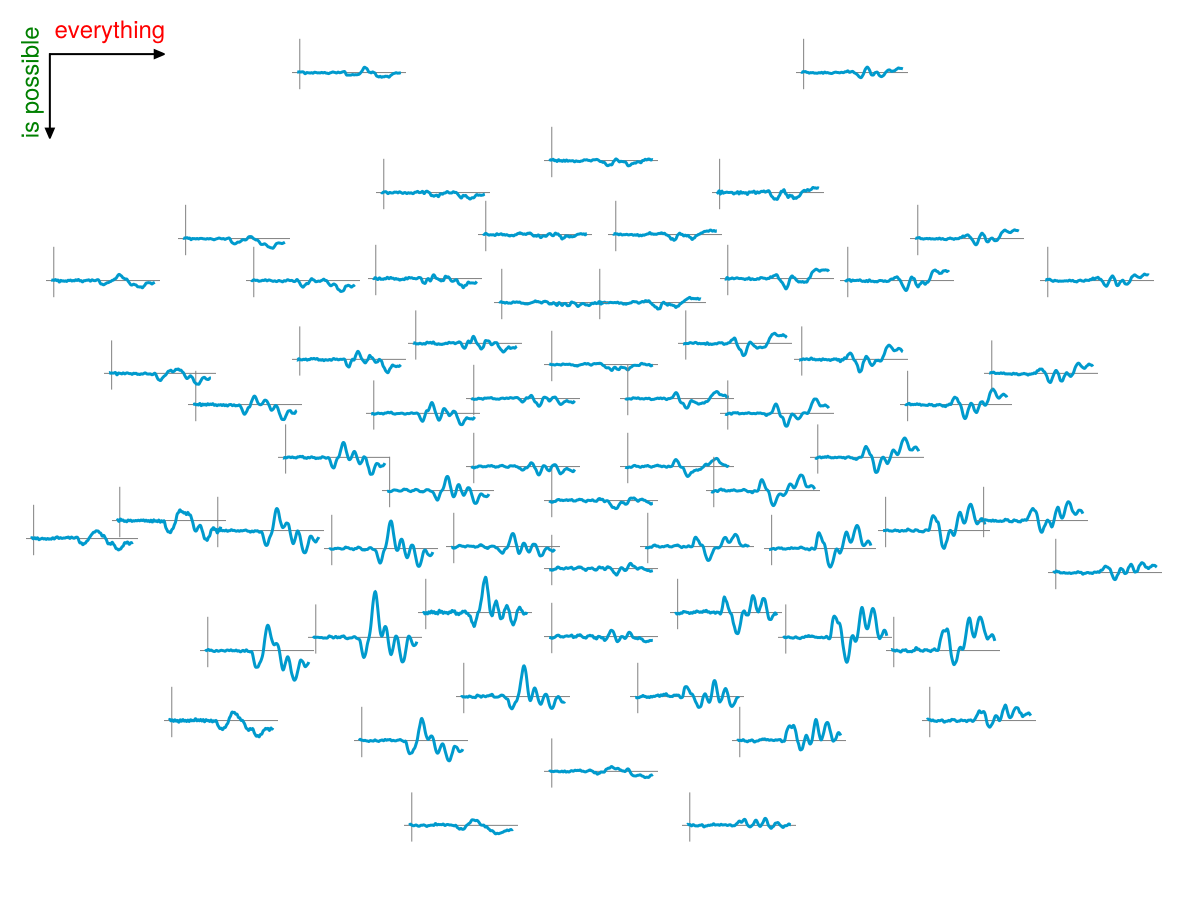
Customizing coordinates inidcator
plot_erpgrid(
    data,
    pos;
    indicator_grid_axis = (;
        arrows_start = [Point2f(0, 0.95), Point2f(0, 0.95)], # Top-left corner
        arrows_dir = [Vec2f(0, -0.1), Vec2f(0.1, 0)], # Downward and right
        text_x_coords = (0.004, 0.996), # Position for the x-axis label (to the left of the x-arrow)
        text_y_coords = (-0.01, 0.85),  # Position for the y-axis label (above the y-arrow)
        text_x_kwargs = (; text = "everything", color = :red),
        text_y_kwargs = (; text = "is possible", color = :green),
    ),
)
Configurations for Channel image
UnfoldMakie.plot_erpgrid — Function
plot_erpgrid(data::Union{Matrix{<:Real}, DataFrame}, positions::Vector; kwargs...)
plot_erpgrid!(f::Union{GridPosition, GridLayout, Figure}, data::Union{Matrix{<:Real}, DataFrame}, positions::Vector, ch_names::Vector{String}; kwargs...)
Plot an ERP image.
Arguments
f::Union{GridPosition, GridLayout, Figure}
Figure,GridLayout, orGridPositionto draw the plot.data::Union{Matrix{<:Real}, DataFrame}
Data for the plot visualization.
Data should has a format of 1 row - 1 channel.positions::Vector{Point{2,Float}}
Electrode positions.ch_names::Vector{String}
Vector with channel names.hlines_grid_axis::NamedTuple = (;)
Here you can flexibly change configurations of the hlines on all subaxes.
To see all options just type?hlinesin REPL.
Defaults: (color = :gray, linewidth = 0.5)vlines_grid_axis::NamedTuple = (;)
Here you can flexibly change configurations of the vlines on all subaxes.
To see all options just type?vlinesin REPL.
Defaults: (color = :gray, linewidth = 0.5, ymin = 0.2, ymax = 0.8)lines_grid_axis::NamedTuple = (;)
Here you can flexibly change configurations of the lines on all subaxes.
To see all options just type?linesin REPL.
Defaults: (color = :deepskyblue3,)labels_grid_axis::NamedTuple = (;)
Here you can flexibly change configurations of the labels on all subaxes.
To see all options just type?textin REPL.
Defaults: (color = :gray, fontsize = 12, align = (:left, :top), space = :relative)indicator_grid_axis::NamedTuple = (;)
Here you can change configurations of inidcator axis.
Defaults: (xlim = [-0.04, 1.0], ylim = [-0.04, 1.0], arrowsstart = Point{2, Float32}[[0.0, 0.0], [0.0, 0.0]], arrowsdir = Vec{2, Float32}[[0.0, 0.1], [0.1, 0.0]], arrowskwargs = (tipwidth = 5, tiplength = 5, shaftwidth = 1), textxcoords = (0.02, 0), textxkwargs = (text = "Time [s]", align = (:left, :top), fontsize = 12), textycoords = (-0.008, 0.01), texty_kwargs = (text = "Voltage [µV]", align = (:left, :baseline), fontsize = 12, rotation = 1.5707963267948966))subaxes::NamedTuple = (;)
Here you can flexibly change configurations of all subaxes. F.e. make them wider or shorter
To see all options just type?Axisin REPL.
Defaults: (width = Relative(0.1f0), height = Relative(0.1f0))
Keyword arguments (kwargs)
drawlabels::Bool = false
Draw channels labels over each waveform.times::Vector = 1:size(data, 2)
Vector ofsize().
Shared plot configuration options
The shared plot options can be used as follows: type = (; key = value, ...)).
For example, plot_x(...; colorbar = (; vertical = true, label = "Test")).
Multiple defaults will be cycled until match.
Placing ; is important!
figure = NamedTuple() - use kwargs... of Makie.Figure
axis = (width = GridLayoutBase.Relative(1.05f0), height = GridLayoutBase.Relative(1.05f0)) - use kwargs... of Makie.Axis
layout = (show_legend = true, use_colorbar = true) - check this page
mapping = (x = (:time,), y = (:estimate, :yhat, :y)) - use any mapping from AlgebraOfGraphics
visual = (colormap = :roma,) - use kwargs... of Makie.lines
legend = (orientation = :vertical, tellwidth = true, tellheight = false, halign = :right, valign = :center) - use kwargs... of Makie.Legend
colorbar = (vertical = true, tellwidth = true, tellheight = false, labelrotation = -1.5707963267948966) - use kwargs... of Makie.Colorbar
Return Value: Figure displaying ERP grid.
This page was generated using Literate.jl.