Butterfly Plot
Butterfly plot is a plot type for visualisation of Event-related potentials. It can fully represent time and channels dimensions using lines. With addition of topoplot inset it can also represent location of channels. It called "butterfly" because the envelope of channels reminds butterfly wings🦋.
The configurations of ERP plots and Butterfly plots are somehow similar.
Setup
Package loading
The following modules are necessary for run this tutorial:
using UnfoldMakie
using Unfold
using CairoMakie
using DataFrames
using Colors
Note that DataFramesMeta is also used here in order to be able to use @subset for testing (filtering).
Data
We filter the data to make it more clearly represented:
df, pos = UnfoldMakie.example_data("TopoPlots.jl")
first(df, 3)| Row | estimate | time | channel | coefname | topo_positions | se | pval |
|---|---|---|---|---|---|---|---|
| Float64 | Float64 | Int64 | String | Any | Float64 | Float64 | |
| 1 | 0.020321 | -0.3 | 1 | A | (0.493714, 0.544031) | 0.122875 | 0.266091 |
| 2 | 0.017548 | -0.298 | 1 | A | (0.493714, 0.544031) | 0.124345 | 0.29664 |
| 3 | 0.0150747 | -0.296 | 1 | A | (0.493714, 0.544031) | 0.124828 | 0.323592 |
Plot Butterfly Plots
The default butterfly plot:
plot_butterfly(df, axis = (; xlabel = "Time [s]"))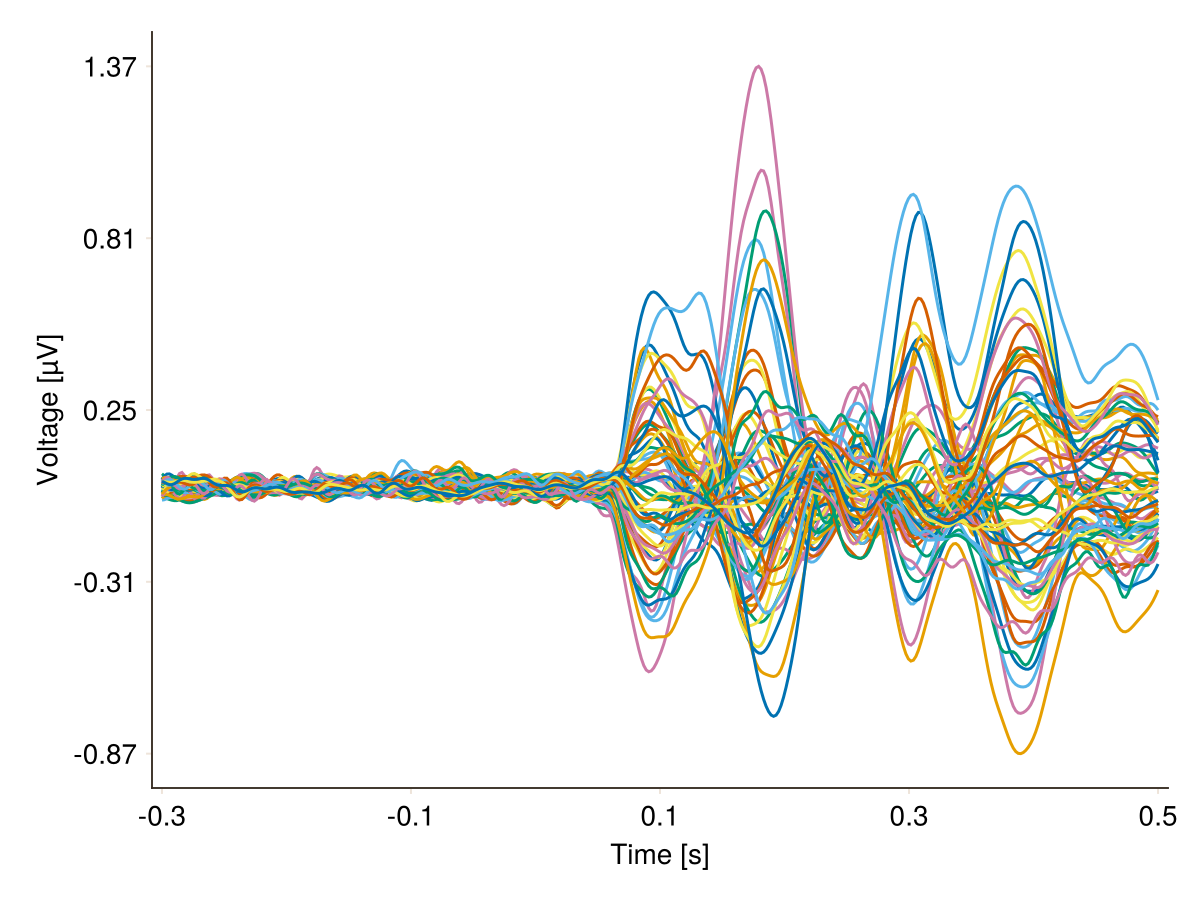
The butterfly plot with corresponding topoplot. You need to provide the channel positions.
plot_butterfly(df; positions = pos, axis = (; xlabel = "Time [s]"))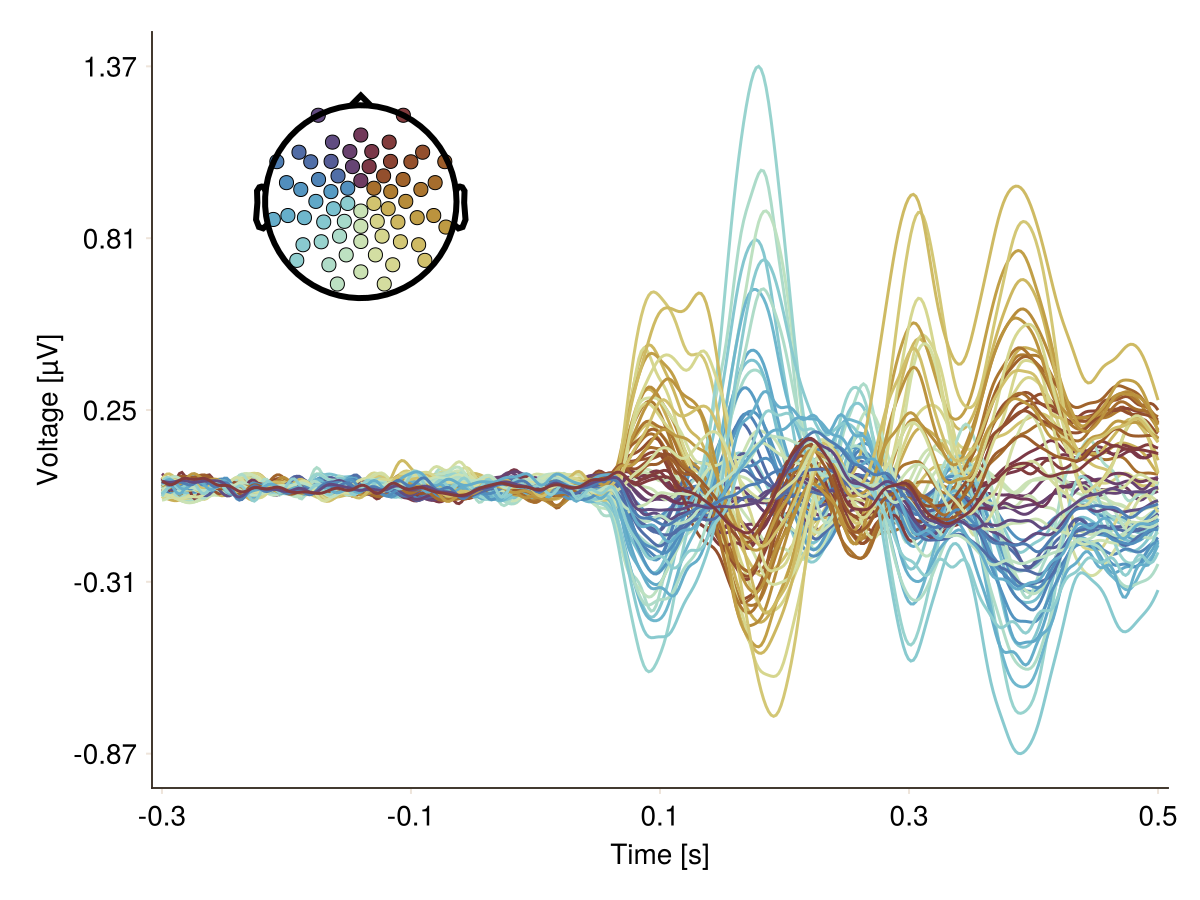
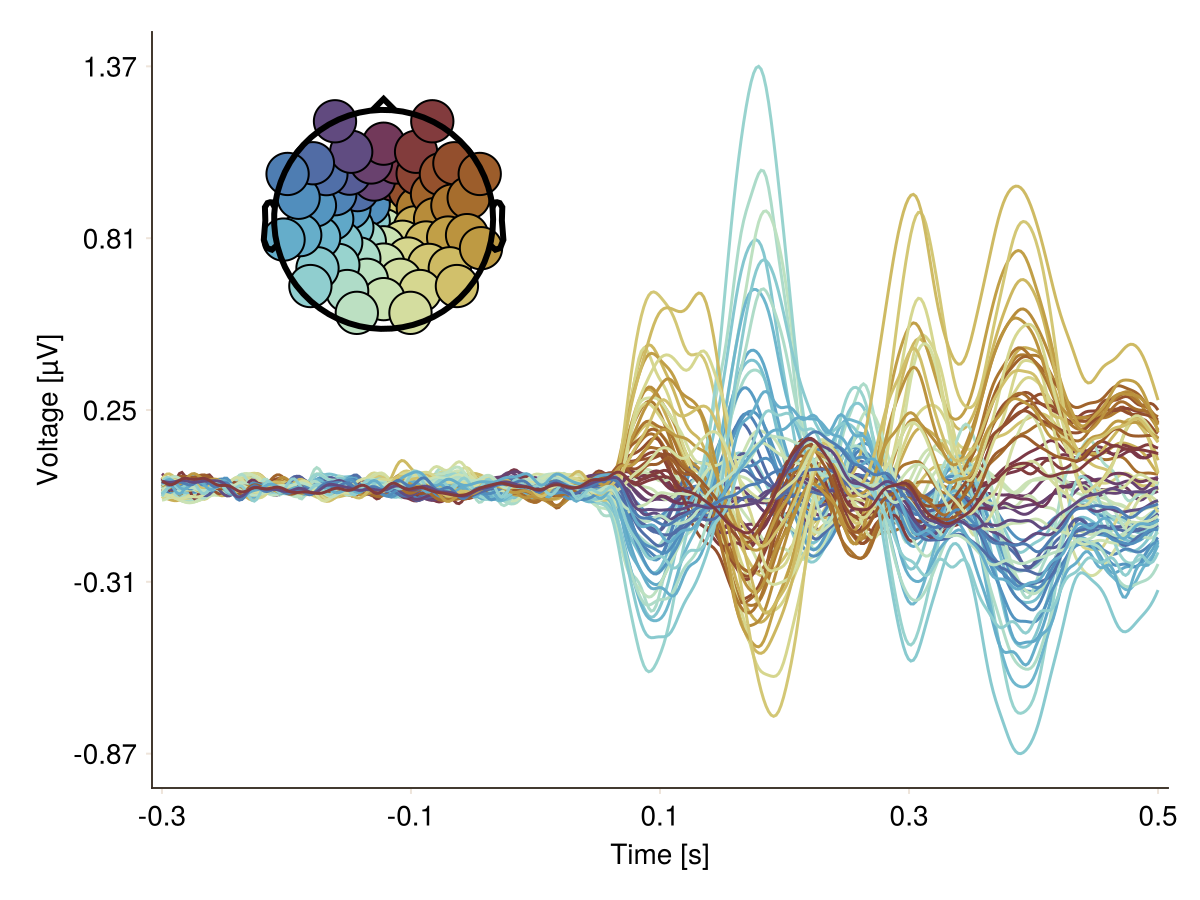
You want to change size of topoplot markers and size of topoplot:
plot_butterfly(
    df;
    positions = pos,
    topo_attributes = (; label_scatter = (; markersize = 30)),
    topo_axis = (; height = Relative(0.4), width = Relative(0.4)),
    axis = (; xlabel = "Time [s]"),
)
You want to add vline and hline:
f = Figure()
plot_butterfly!(f, df; positions = pos, axis = (; xlabel = "Time [s]"))
hlines!(0, color = :gray, linewidth = 1)
vlines!(0, color = :gray, linewidth = 1)
f
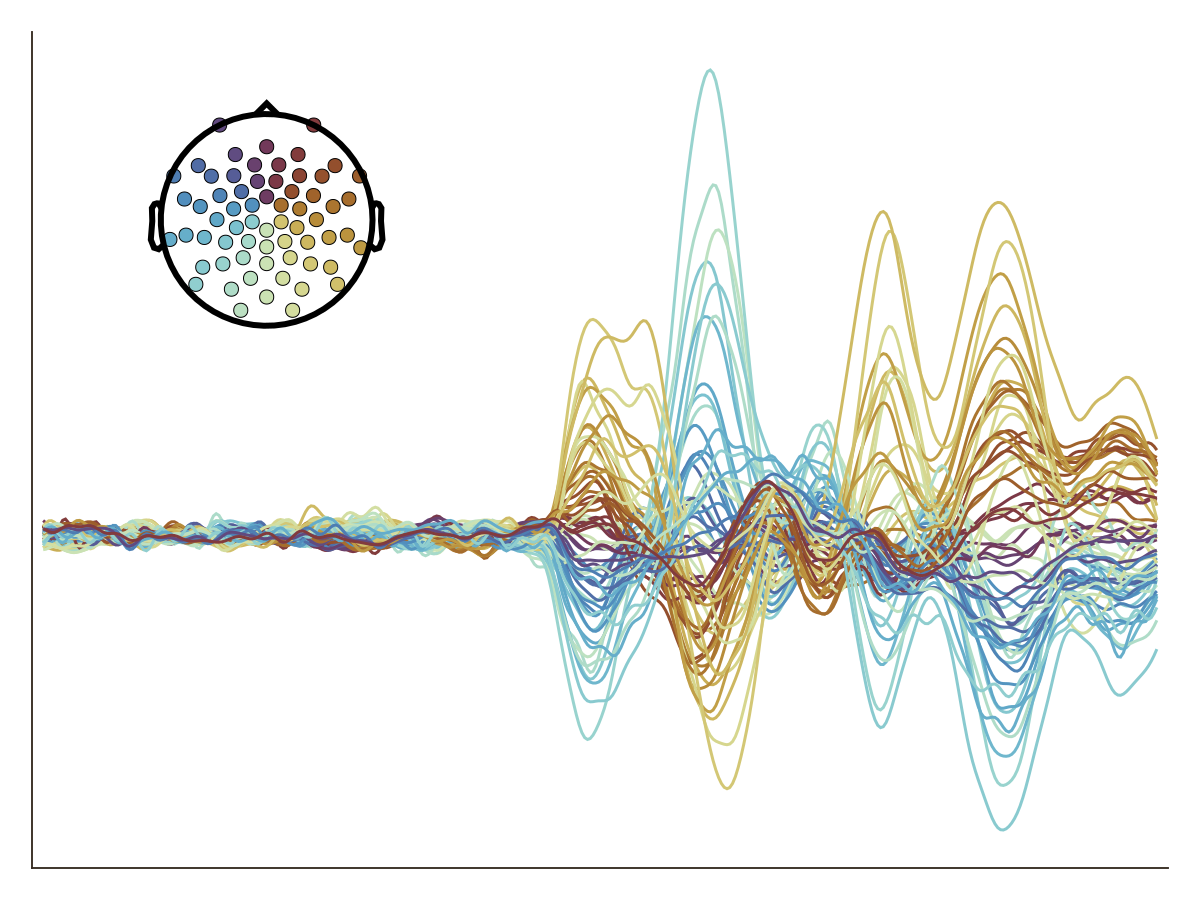
You want to remove all decorations:
plot_butterfly(
    df;
    positions = pos,
    axis = (; xlabel = "Time [s]"),
    layout = (; hidedecorations = (:label => true, :ticks => true, :ticklabels => true)),
)
Changing the colors of channels
Please check this page.
You want to highlight a specific channel or channels. Specify channels first:
df.highlight1 = in.(df.channel, Ref([12])) # for single channel
df.highlight2 = in.(df.channel, Ref([10, 12])) # for multiple channels
Second, you can highlight it or them by color.
gray = Colors.RGB(128 / 255, 128 / 255, 128 / 255)
f = Figure(size = (1000, 400))
plot_butterfly!(
    f[1, 1],
    df;
    positions = pos,
    mapping = (; color = :highlight1),
    visual = (; color = 1:2, colormap = [gray, :red]),
    axis = (; xlabel = "Time [s]"),
)
plot_butterfly!(
    f[1, 2],
    df;
    positions = pos,
    mapping = (; color = :highlight2),
    visual = (; color = 1:2, colormap = [gray, :red]),
    axis = (; xlabel = "Time [s]"),
)
f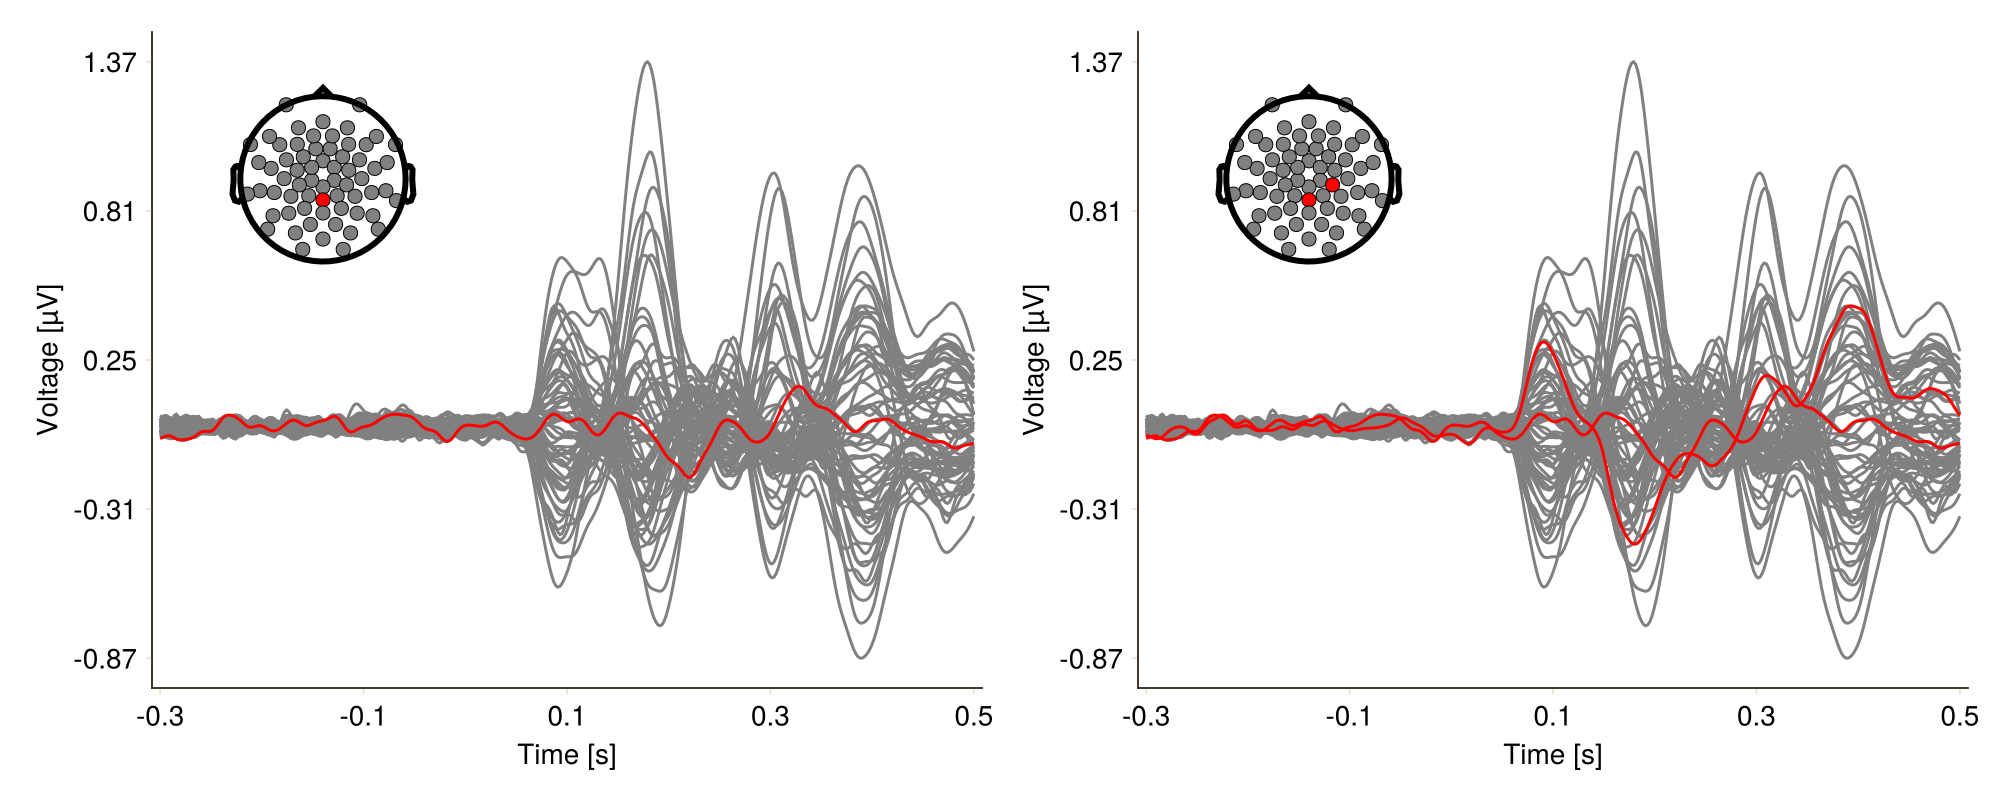
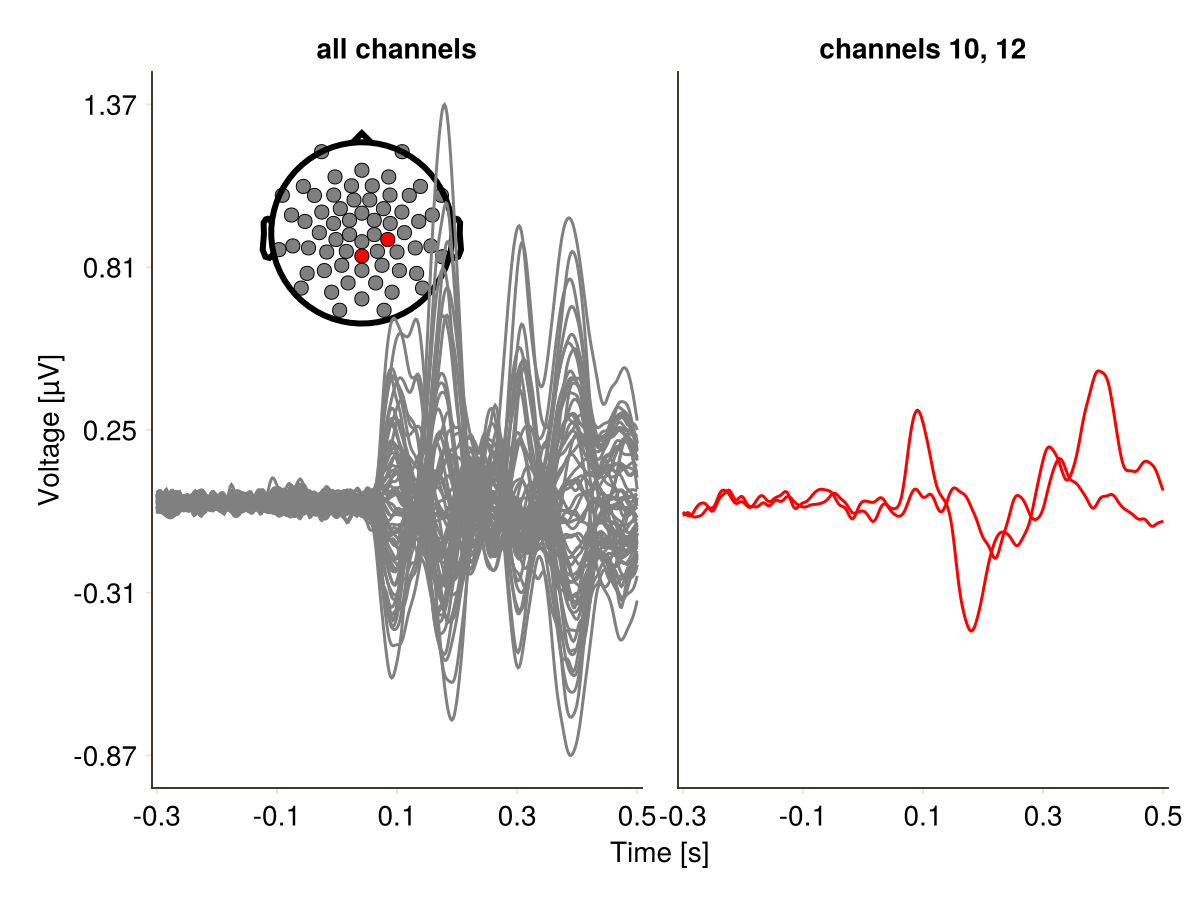
Or by faceting:
df.highlight2 = replace(df.highlight2, true => "channels 10, 12", false => "all channels")

plot_butterfly(
    df;
    positions = pos,
    mapping = (; color = :highlight2, col = :highlight2),
    visual = (; color = 1:2, colormap = [gray, :red]),
    axis = (; xlabel = "Time [s]"),
)
Column Mappings
Since butterfly plots use a DataFrame as input, the library needs to know the names of the columns used for plotting. You can set these mapping values by calling plot_butterfly(...; mapping=(; :x=:time)). Just specify a NamedTuple. Note the ; right after the opening parentheses.
Configurations of Butterfly Plot
UnfoldMakie.plot_butterfly — Function
plot_butterfly(plot_data::Union{DataFrame, AbstractMatrix}; kwargs...)
plot_butterfly(times::Vector, plot_data::Union{DataFrame, AbstractMatrix}; kwargs...)
plot_butterfly!(f::Union{GridPosition, GridLayout, Figure}, plot_data::Union{DataFrame, AbstractMatrix}; kwargs...)
Plot a Butterfly plot.
Arguments
f::Union{GridPosition, GridLayout, Figure}
Figure,GridLayout, orGridPositionto draw the plot.data::Union{DataFrame, AbstractMatrix}
Data for the ERP plot visualization.kwargs...
Additional styling behavior.
Often used as:plot_butterfly(df; visual = (; colormap = :romaO)).
Keyword arguments (kwargs)
positions::Array = []
Adds a topoplot as an inset legend to the provided channel positions. Must be the same length asplot_data. To change the colors of the channel lines use thetopoposition_to_colorfunction.nticks::Union{Int,Tuple{Int,Int}, NamedTuple{(:x,:y),Tuple{Int,Int}}}= 5
Set the number of tick positions (x,y). Acepts 3 types fo arguments: 6 (=both axes are 6), (5,7), or (x=5, y=7). Controls positions only (use xtickformat/ytickformat for labels).topolegend::Bool = true
Show an inlay topoplot with corresponding electrodes. Requirespositions.topopositions_to_color::x -> pos_to_color_RomaO(x)
Change the line colors.topo_axis::NamedTuple = (;)
Here you can flexibly change configurations of the topoplot axis.
To see all options just type?Axisin REPL.
Defaults: (width = Relative(0.35f0), height = Relative(0.35f0), halign = 0.05, valign = 0.95, aspect = 1)topo_attributes::NamedTuple = (;)
Here you can flexibly change configurations of the topoplot interoplation.
To see all options just type?Topoplot.topoplotin REPL.
Defaults: (head = (color = :black, linewidth = 1), label_scatter = (markersize = 10, strokewidth = 0.5), interpolation = TopoPlots.NullInterpolator())mapping = (;)
For highlighting specific channels.
Example:mapping = (; color = :highlight)), where:highlightis variable with appopriate mapping.
Return Value: Figure displaying Butterfly plot.
Shared plot configuration options
The shared plot options can be used as follows: type = (; key = value, ...)).
For example, plot_x(...; colorbar = (; vertical = true, label = "Test")).
Multiple defaults will be cycled until match.
Placing ; is important!
figure = NamedTuple() - use kwargs... of Makie.Figure
axis = (xlabel = "Time [s]", ylabel = "Voltage [µV]", yticklabelsize = 14, xtickformat = UnfoldMakie.var"#PlotConfig##0#PlotConfig##1"(), ytickformat = UnfoldMakie.var"#PlotConfig##2#PlotConfig##3"(), xautolimitmargin = (0.01, 0.01)) - use kwargs... of Makie.Axis
layout = (show_legend = false, use_colorbar = true, use_legend = true, hidespines = (:r, :t), hidedecorations = Dict{Symbol, Bool}(:label => 0, :ticks => 0, :ticklabels => 0)) - check this page
mapping = (x = (:time,), y = (:estimate, :yhat, :y), color = (:channel, :channels, :trial, :trials), positions = (:pos, :positions, :position, :topo_positions, :x, nothing), labels = (:labels, :label, :topoLabels, :sensor, nothing), group = (:channel,)) - use any mapping from AlgebraOfGraphics
visual = (colormap = nothing, color = nothing) - use kwargs... of Makie.lines
legend = (orientation = :vertical, tellwidth = true, tellheight = false, halign = :right, valign = :center, framevisible = false, position = :right) - use kwargs... of Makie.Legend
colorbar = (vertical = true, tellwidth = true, tellheight = false, labelrotation = -1.5707963267948966, label = "", flipaxis = true) - use kwargs... of AlgebraOfGraphics.colorbar!
see also plot_erp
This page was generated using Literate.jl.